AMD Results Presentation Deck
APPENDICES
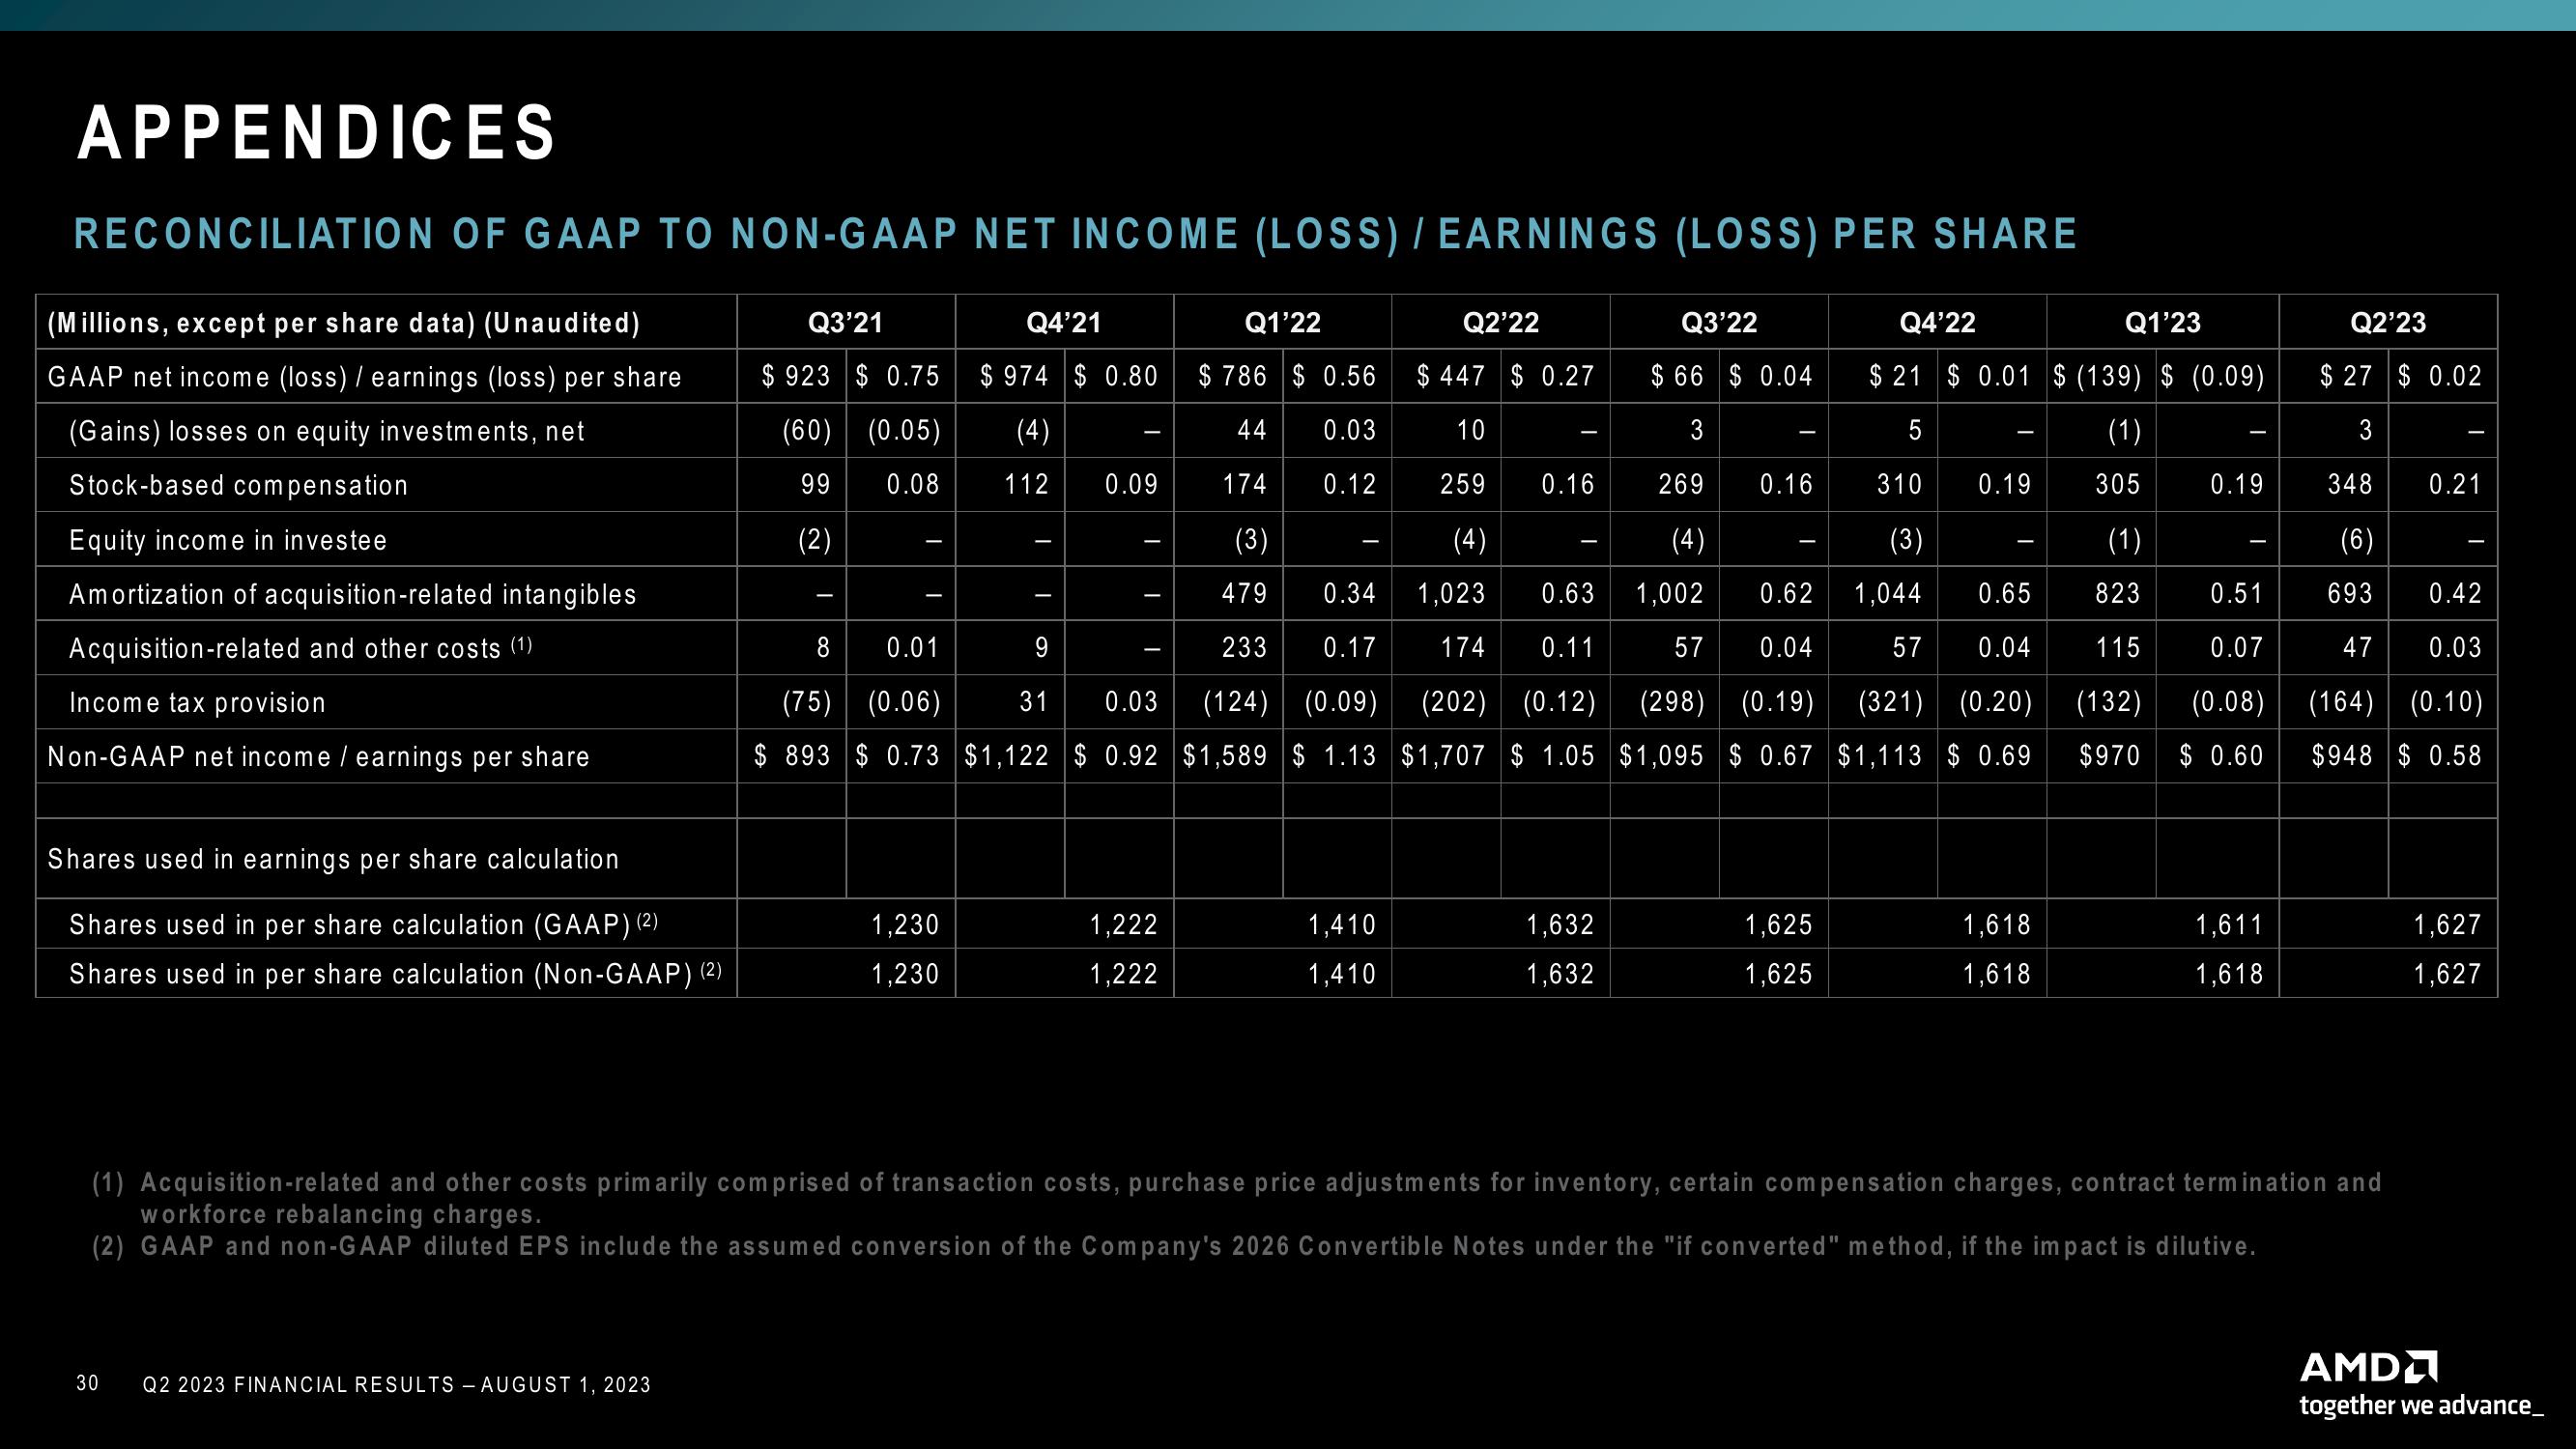
RECONCILIATION OF GAAP TO NON-GAAP NET INCOME (LOSS) / EARNINGS (LOSS) PER SHARE
(Millions, except per share data) (Unaudited)
GAAP net income (loss) / earnings (loss) per share
(Gains) losses on equity investments, net
Stock-based compensation
Equity income in investee
Amortization of acquisition-related intangibles
Acquisition-related and other costs (1)
Income tax provision
Non-GAAP net income / earnings per share
Shares used in earnings per share calculation
Shares used in per share calculation (GAAP) (2)
Shares used in per share calculation (Non-GAAP) (2)
30
Q2'22
$66 $0.04
$447 $ 0.27
10
3
259 0.16 269
(4)
(4)
1,023 0.63 1,002
174 0.11 57 0.04
0.51
0.34
0.17
8
0.01
9
0.07
(75) (0.06)
31 0.03 (124) (0.09) (202) (0.12) (298) (0.19) (321) (0.20) (132)
(0.08)
$ 893 $ 0.73 $1,122 $ 0.92 $1,589 $ 1.13 $1,707 $ 1.05 $1,095 $ 0.67 $1,113 $0.69 $970 $ 0.60
Q2 2023 FINANCIAL RESULTS - AUGUST 1, 2023
Q3'21
$923 $0.75
(60)| (0.05)
99 0.08
(2)
-
1,230
1,230
Q4'21
$974 $ 0.80
(4)
112 0.09
I
I
1,222
1,222
Q1'22
$786 $ 0.56
44 0.03
0.12
174
(3)
479
233
-
1,410
1,410
1,632
1,632
Q3'22
Q4'22
Q1'23
$ 21 $ 0.01 $ (139) $ (0.09)
5
(1)
305
310
(3)
0.62 1,044
-
0.16
1,625
1,625
0.19
0.65
57 0.04
1,618
1,618
(1)
823
115
-
0.19
1,611
1,618
Q2'23
(1) Acquisition-related and other costs primarily comprised of transaction costs, purchase price adjustments for inventory, certain compensation charges, contract termination and
workforce rebalancing charges.
(2) GAAP and non-GAAP diluted EPS include the assumed conversion of the Company's 2026 Convertible Notes under the "if converted" method, if the impact is dilutive.
$27 $0.02
3
348
(6)
693
0.42
47 0.03
(164) (0.10)
$948 $ 0.58
I
0.21
1,627
1,627
AMD
together we advance_View entire presentation