Confluent Investor Presentation Deck
69.5%
FY'21
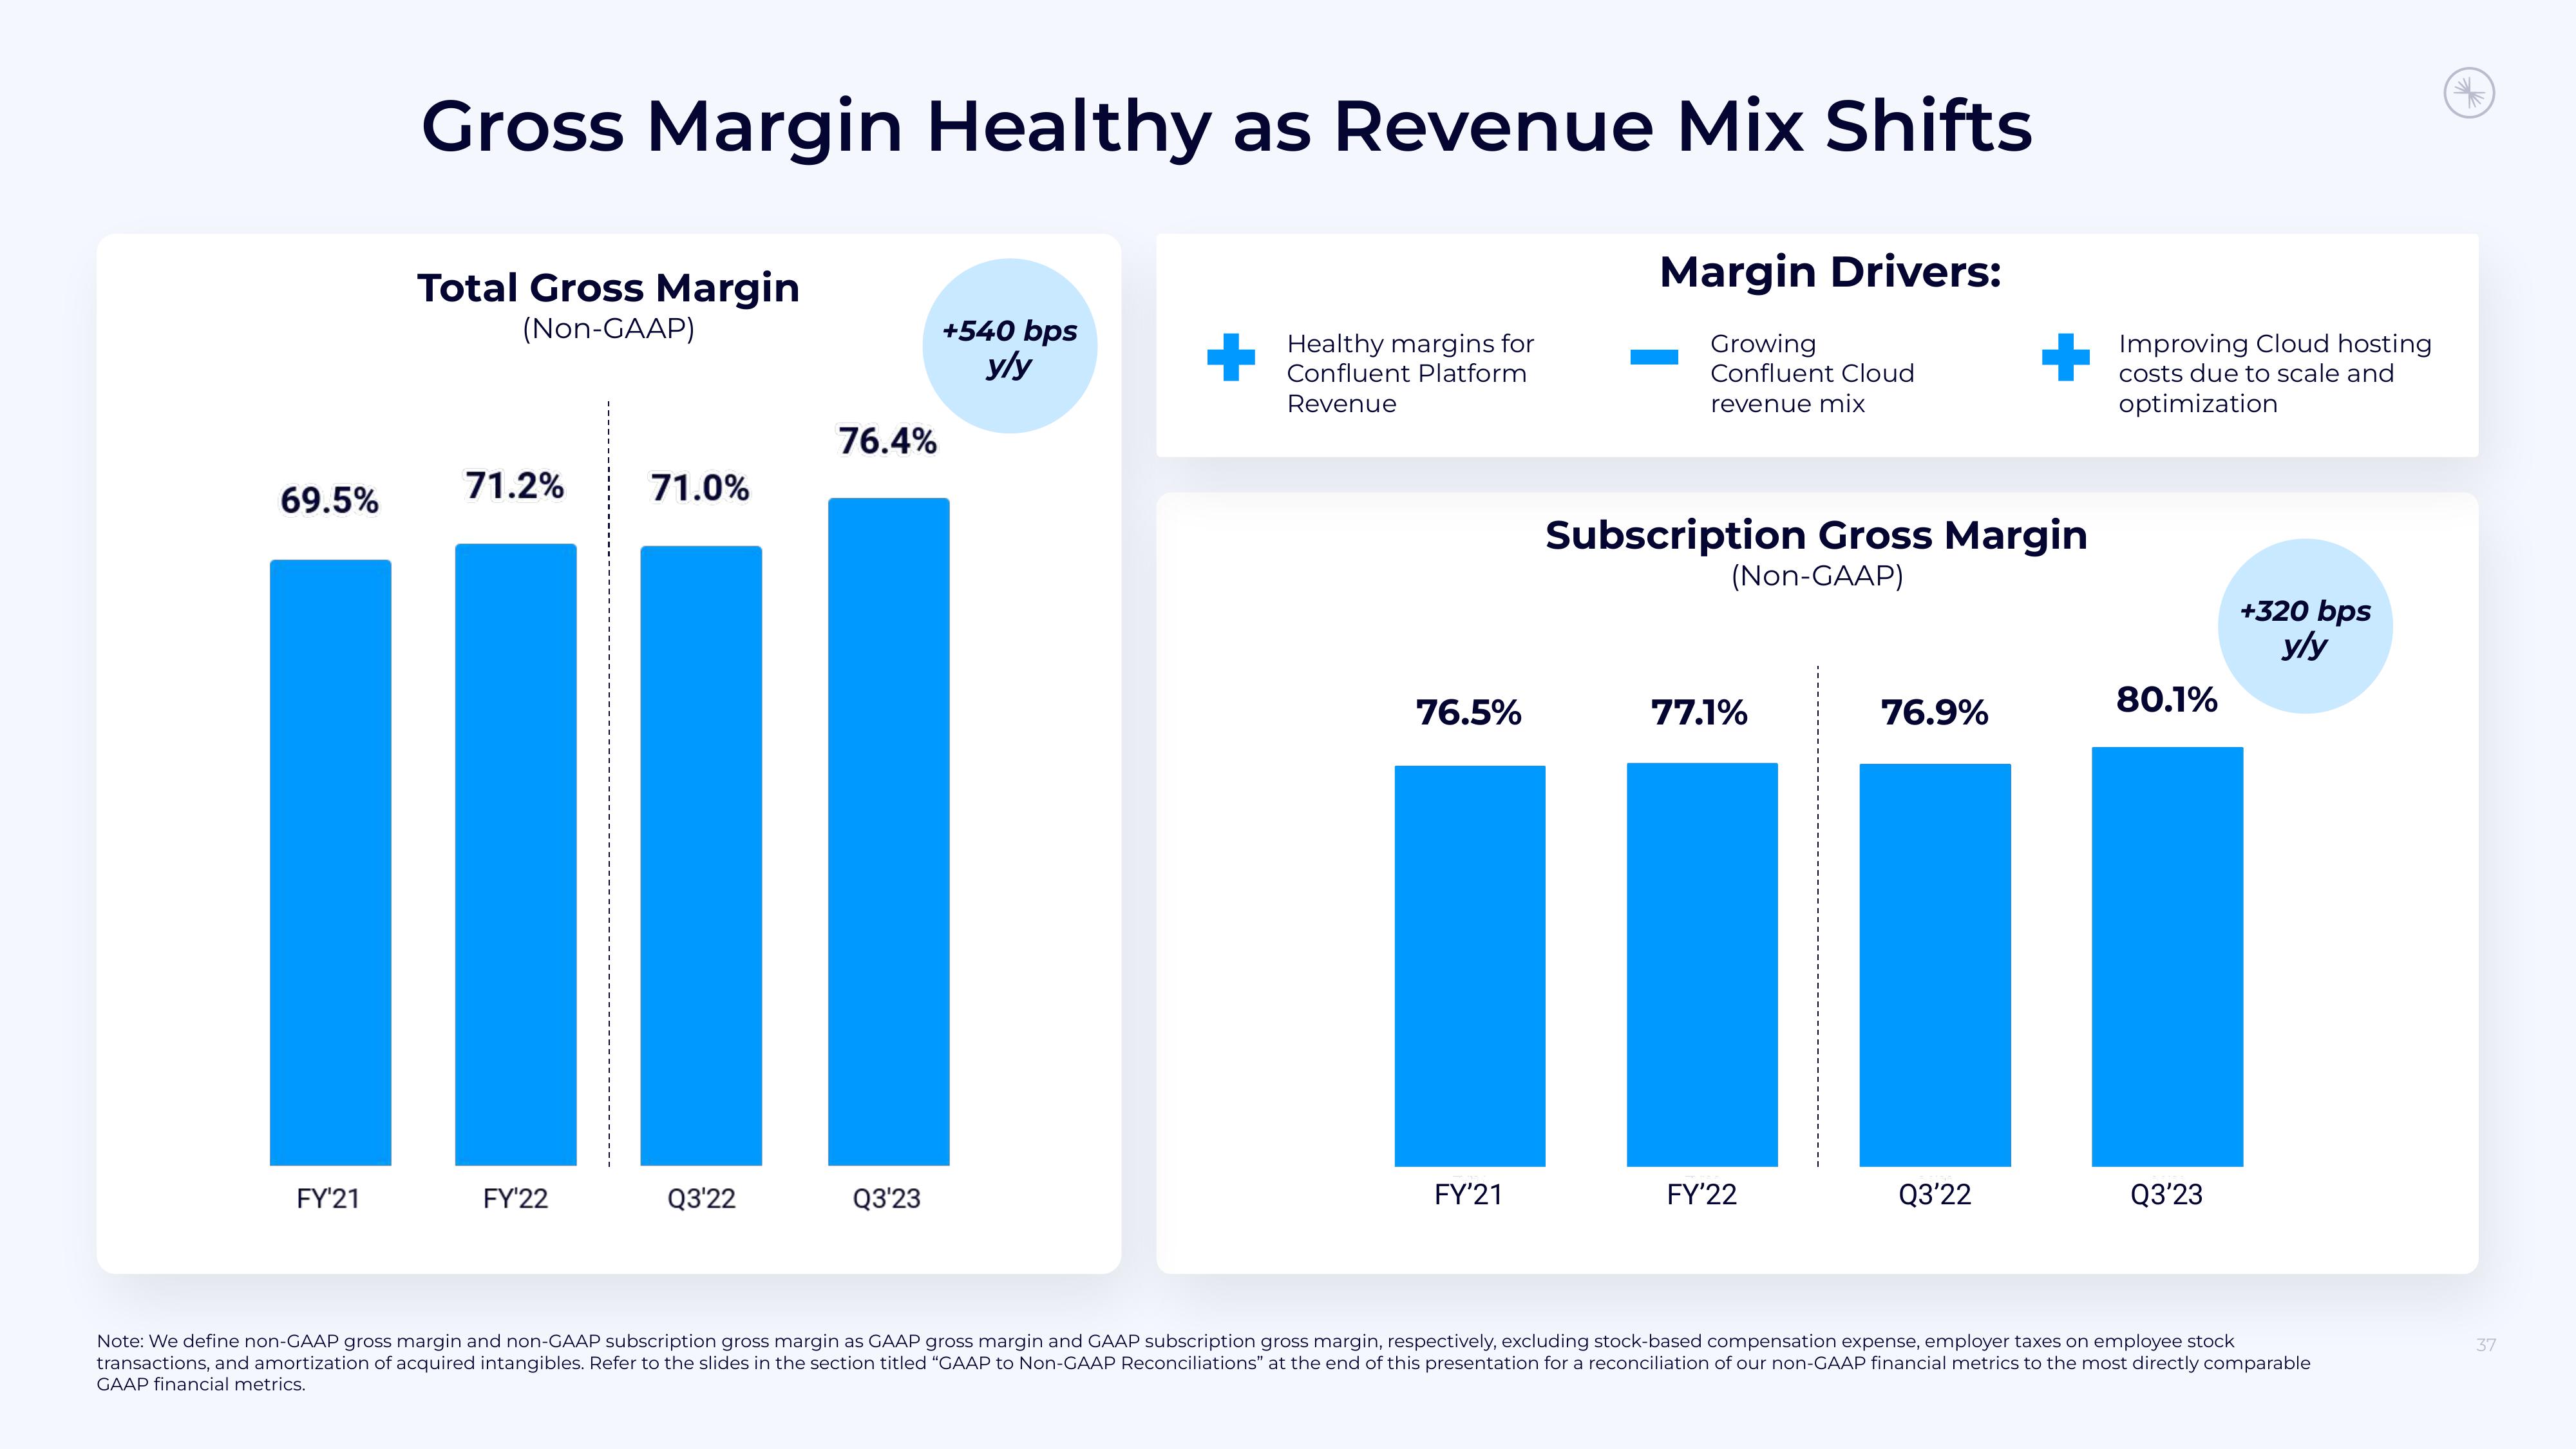
Gross Margin Healthy as Revenue Mix Shifts
Total Gross Margin
(Non-GAAP)
71.2%
FY'22
71.0%
Q3'22
76.4%
Q3'23
+540 bps
yly
Healthy margins for
Confluent Platform
Revenue
76.5%
FY'21
Margin Drivers:
Growing
Confluent Cloud
revenue mix
Subscription Gross Margin
(Non-GAAP)
77.1%
FY'22
76.9%
Q3'22
Improving Cloud hosting
costs due to scale and
optimization
80.1%
Q3'23
+320 bps
yly
Note: We define non-GAAP gross margin and non-GAAP subscription gross margin as GAAP gross margin and GAAP subscription gross margin, respectively, excluding stock-based compensation expense, employer taxes on employee stock
transactions, and amortization of acquired intangibles. Refer to the slides in the section titled "GAAP to Non-GAAP Reconciliations" at the end of this presentation for a reconciliation of our non-GAAP financial metrics to the most directly comparable
GAAP financial metrics.
37View entire presentation