Opendoor Investor Presentation Deck
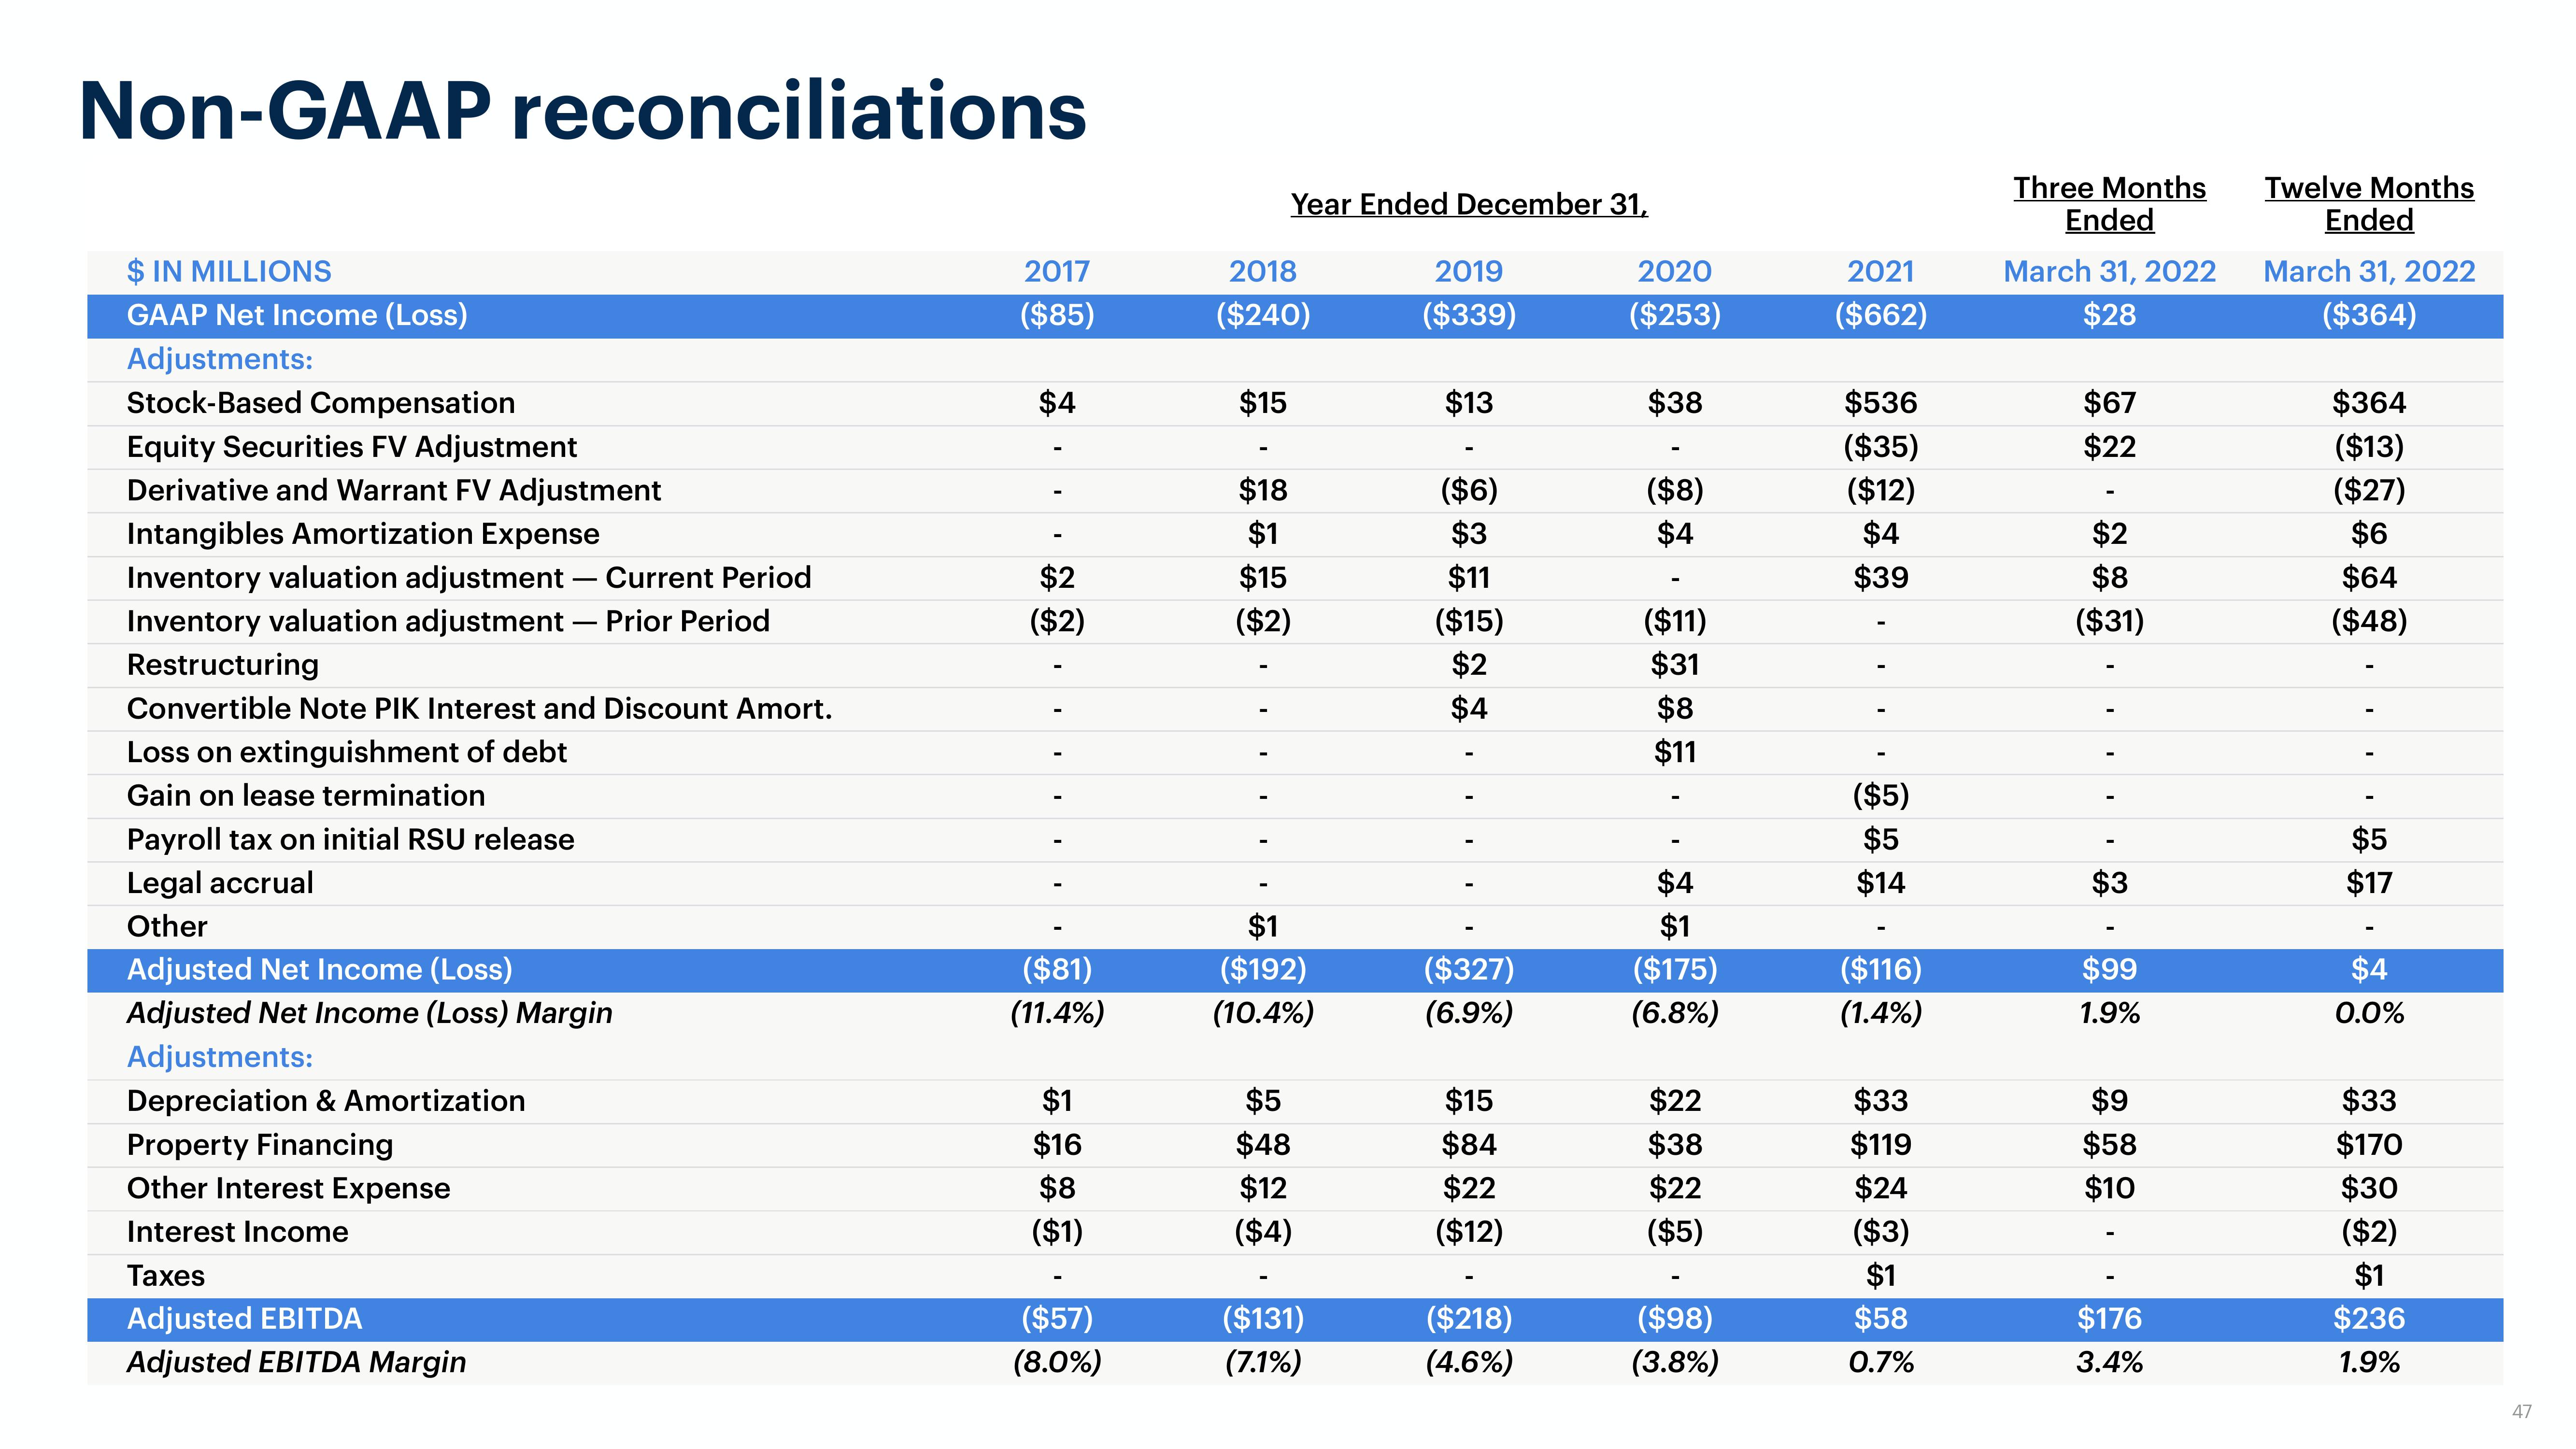
Non-GAAP reconciliations
$ IN MILLIONS
GAAP Net Income (Loss)
Adjustments:
Stock-Based Compensation
Equity Securities FV Adjustment
Derivative and Warrant FV Adjustment
Intangibles Amortization Expense
Inventory valuation adjustment - Current Period
Inventory valuation adjustment - Prior Period
Restructuring
Convertible Note PIK Interest and Discount Amort.
Loss on extinguishment of debt
Gain on lease termination
Payroll tax on initial RSU release
Legal accrual
Other
Adjusted Net Income (Loss)
Adjusted Net Income (Loss) Margin
Adjustments:
Depreciation & Amortization
Property Financing
Other Interest Expense
Interest Income
Taxes
Adjusted EBITDA
Adjusted EBITDA Margin
2017
($85)
$4
$2
($2)
($81)
(11.4%)
$1
$16
$8
($1)
($57)
(8.0%)
Year Ended December 31,
2018
($240)
$15
$18
$1
$15
($2)
$1
($192)
(10.4%)
$5
$48
$12
($4)
($131)
(7.1%)
2019
($339)
$13
($6)
$3
$11
($15)
$2
$4
($327)
(6.9%)
$15
$84
$22
($12)
($218)
(4.6%)
2020
($253)
$38
($8)
$4
($11)
$31
$8
$11
$4
$1
($175)
(6.8%)
$22
$38
$22
($5)
($98)
(3.8%)
2021
($662)
$536
($35)
($12)
$4
$39
($5)
$5
$14
($116)
(1.4%)
$33
$119
$24
($3)
$1
$58
0.7%
Three Months
Ended
March 31, 2022
$28
$67
$22
$2
$8
($31)
$3
$99
1.9%
$9
$58
$10
$176
3.4%
Twelve Months
Ended
March 31, 2022
($364)
$364
($13)
($27)
$6
$64
($48)
$5
$17
$4
0.0%
$33
$170
$30
($2)
$1
$236
1.9%
47View entire presentation