WeWork Results Presentation Deck
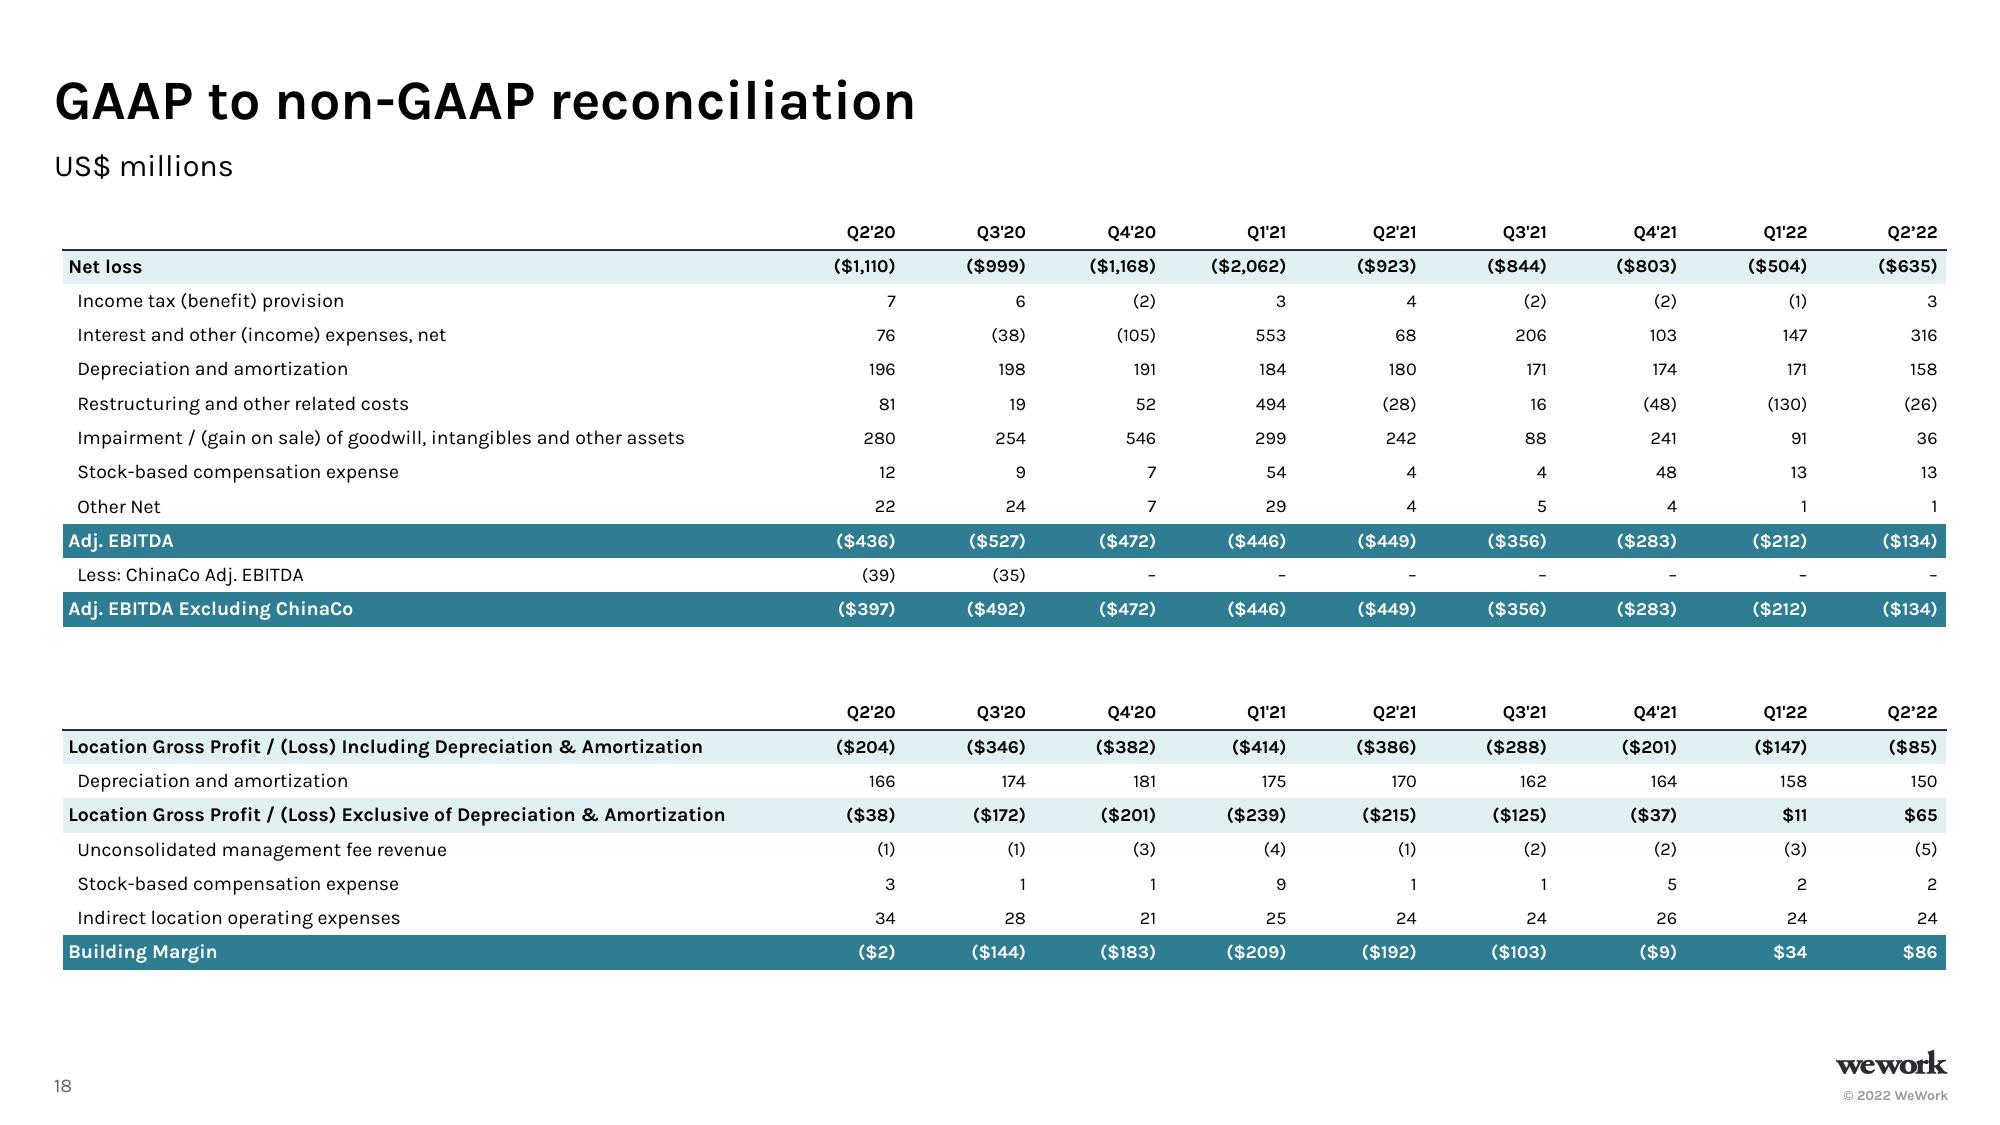
GAAP to non-GAAP reconciliation
US$ millions
Net loss
Income tax (benefit) provision
Interest and other (income) expenses, net
Depreciation and amortization
Restructuring and other related costs
Impairment / (gain on sale) of goodwill, intangibles and other assets
Stock-based compensation expense
Other Net
Adj. EBITDA
Less: ChinaCo Adj. EBITDA
Adj. EBITDA Excluding China Co
Location Gross Profit/ (Loss) Including Depreciation & Amortization
Depreciation and amortization
Location Gross Profit / (Loss) Exclusive of Depreciation & Amortization
Unconsolidated management fee revenue
Stock-based compensation expense
Indirect location operating expenses
Building Margin
18
Q2'20
($1,110)
7
76
196
81
280
12
22
($436)
(39)
($397)
Q2'20
($204)
166
($38)
(1)
3
34
($2)
Q3'20
($999)
6
(38)
198
19
254
9
24
($527)
(35)
($492)
Q3'20
($346)
174
($172)
(1)
1
28
($144)
Q4'20
($1,168)
(2)
(105)
191
52
546
7
7
($472)
($472)
Q4'20
($382)
181
($201)
(3)
1
21
($183)
Q1'21
($2,062)
3
553
184
494
299
54
29
($446)
($446)
Q1'21
($414)
175
($239)
(4)
9
25
($209)
Q2'21
($923)
4
68
180
(28)
242
4
4
($449)
($449)
Q2'21
($386)
170
($215)
(1)
1
24
($192)
Q3'21
($844)
(2)
206
171
16
88
4
5
($356)
($356)
Q3'21
($288)
162
($125)
(2)
1
24
($103)
Q4'21
($803)
(2)
103
174
(48)
241
48
4
($283)
($283)
Q4'21
($201)
164
($37)
(2)
5
26
($9)
Q1'22
($504)
(1)
147
171
(130)
91
13
1
($212)
($212)
Q1'22
($147)
158
$11
(3)
2
24
$34
Q2'22
($635)
3
316
158
(26)
36
13
1
($134)
($134)
Q2'22
($85)
150
$65
(5)
2
24
$86
wework
Ⓒ2022 WeWorkView entire presentation