First Busey Results Presentation Deck
4Q23 Earnings Investor Presentation
Exp.
Focused Control on Expenses
Noninterest Expense
Noninterest Exp.
Unfunded
Provision
$ in millions
Acq./Restructuring
1
Intangible Amort.
NMTC Amort.
Adj. Core Exp.(¹)
$73.7
55.8%
2022 Q4
Expenses ex-Acq.
Adj. Core Efficiency Ratio ¹
$73.7
- $0.5
$2.4
$2.8
$1.7
$67.2
$70.4
55.6%
2023 Q1
$70.4
- $0.6
$0.0
$2.7
$2.2
First Busey Corporation | Ticker: BUSE
$66.1
$69.2
58.6%
2023 Q2
Acq./Restructuring Exp.
$69.2
$0.3
$0.0
$2.7
$2.3
$64.0
$70.9
60.2%
2023 Q3
$70.9
$0.0
$0.1
$2.6
$2.3
$66.0
$75.0
60.1%
2023 Q4
$75.0
$0.8
$4.2
$2.5
$2.3
$65.2
I
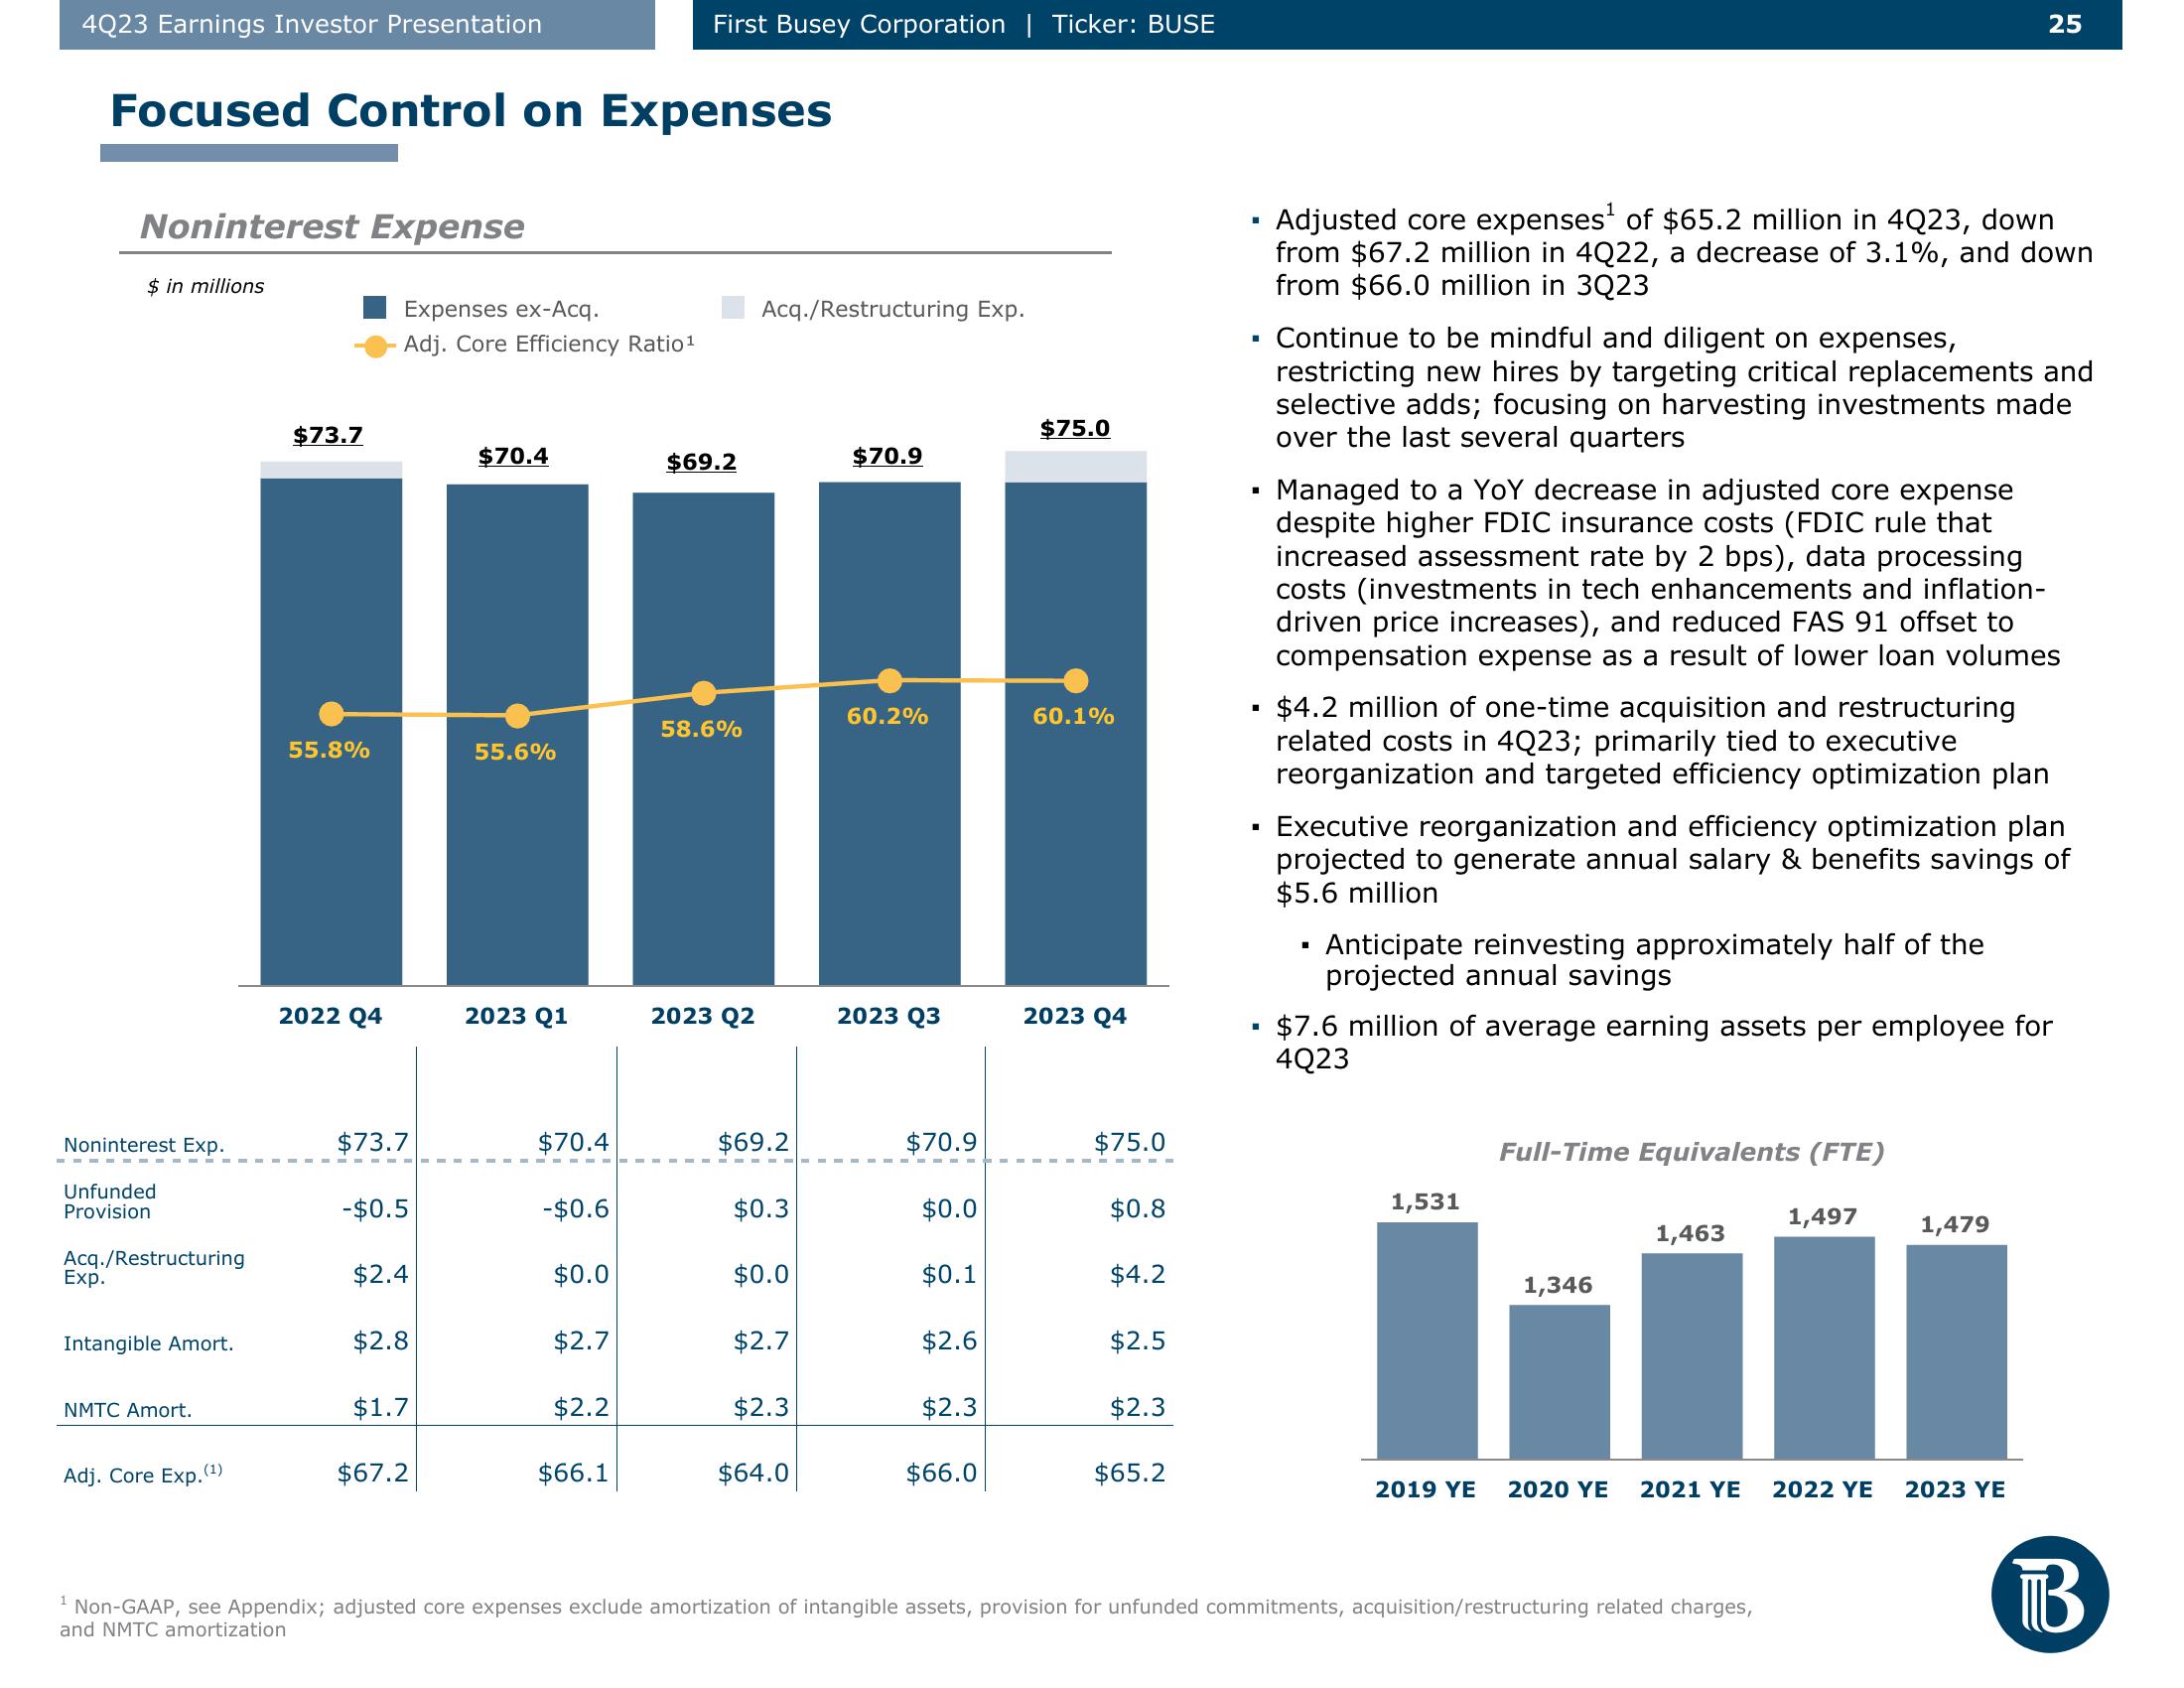
Adjusted core expenses¹ of $65.2 million in 4Q23, down
from $67.2 million in 4Q22, a decrease of 3.1%, and down
from $66.0 million in 3Q23
Continue to be mindful and diligent on expenses,
restricting new hires by targeting critical replacements and
selective adds; focusing on harvesting investments made
over the last several quarters
Managed to a YoY decrease in adjusted core expense
despite higher FDIC insurance costs (FDIC rule that
increased assessment rate by 2 bps), data processing
costs (investments in tech enhancements and inflation-
driven price increases), and reduced FAS 91 offset to
compensation expense as a result of lower loan volumes
$4.2 million of one-time acquisition and restructuring
related costs in 4Q23; primarily tied to executive
reorganization and targeted efficiency optimization plan
Executive reorganization and efficiency optimization plan
projected to generate annual salary & benefits savings of
$5.6 million
■
Anticipate reinvesting approximately half of the
projected annual savings
$7.6 million of average earning assets per employee for
4Q23
1,531
Full-Time Equivalents (FTE)
1,346
25
1,463
2019 YE 2020 YE 2021 YE
Non-GAAP, see Appendix; adjusted core expenses exclude amortization of intangible assets, provision for unfunded commitments, acquisition/restructuring related charges,
and NMTC amortization
1,497
1,479
2022 YE 2023 YE
BView entire presentation