Kinnevik Results Presentation Deck
Intro
SEKM
NET ASSET VALUE
LEGACY ASSETS, FINANCIAL POSITION & TOTALITY
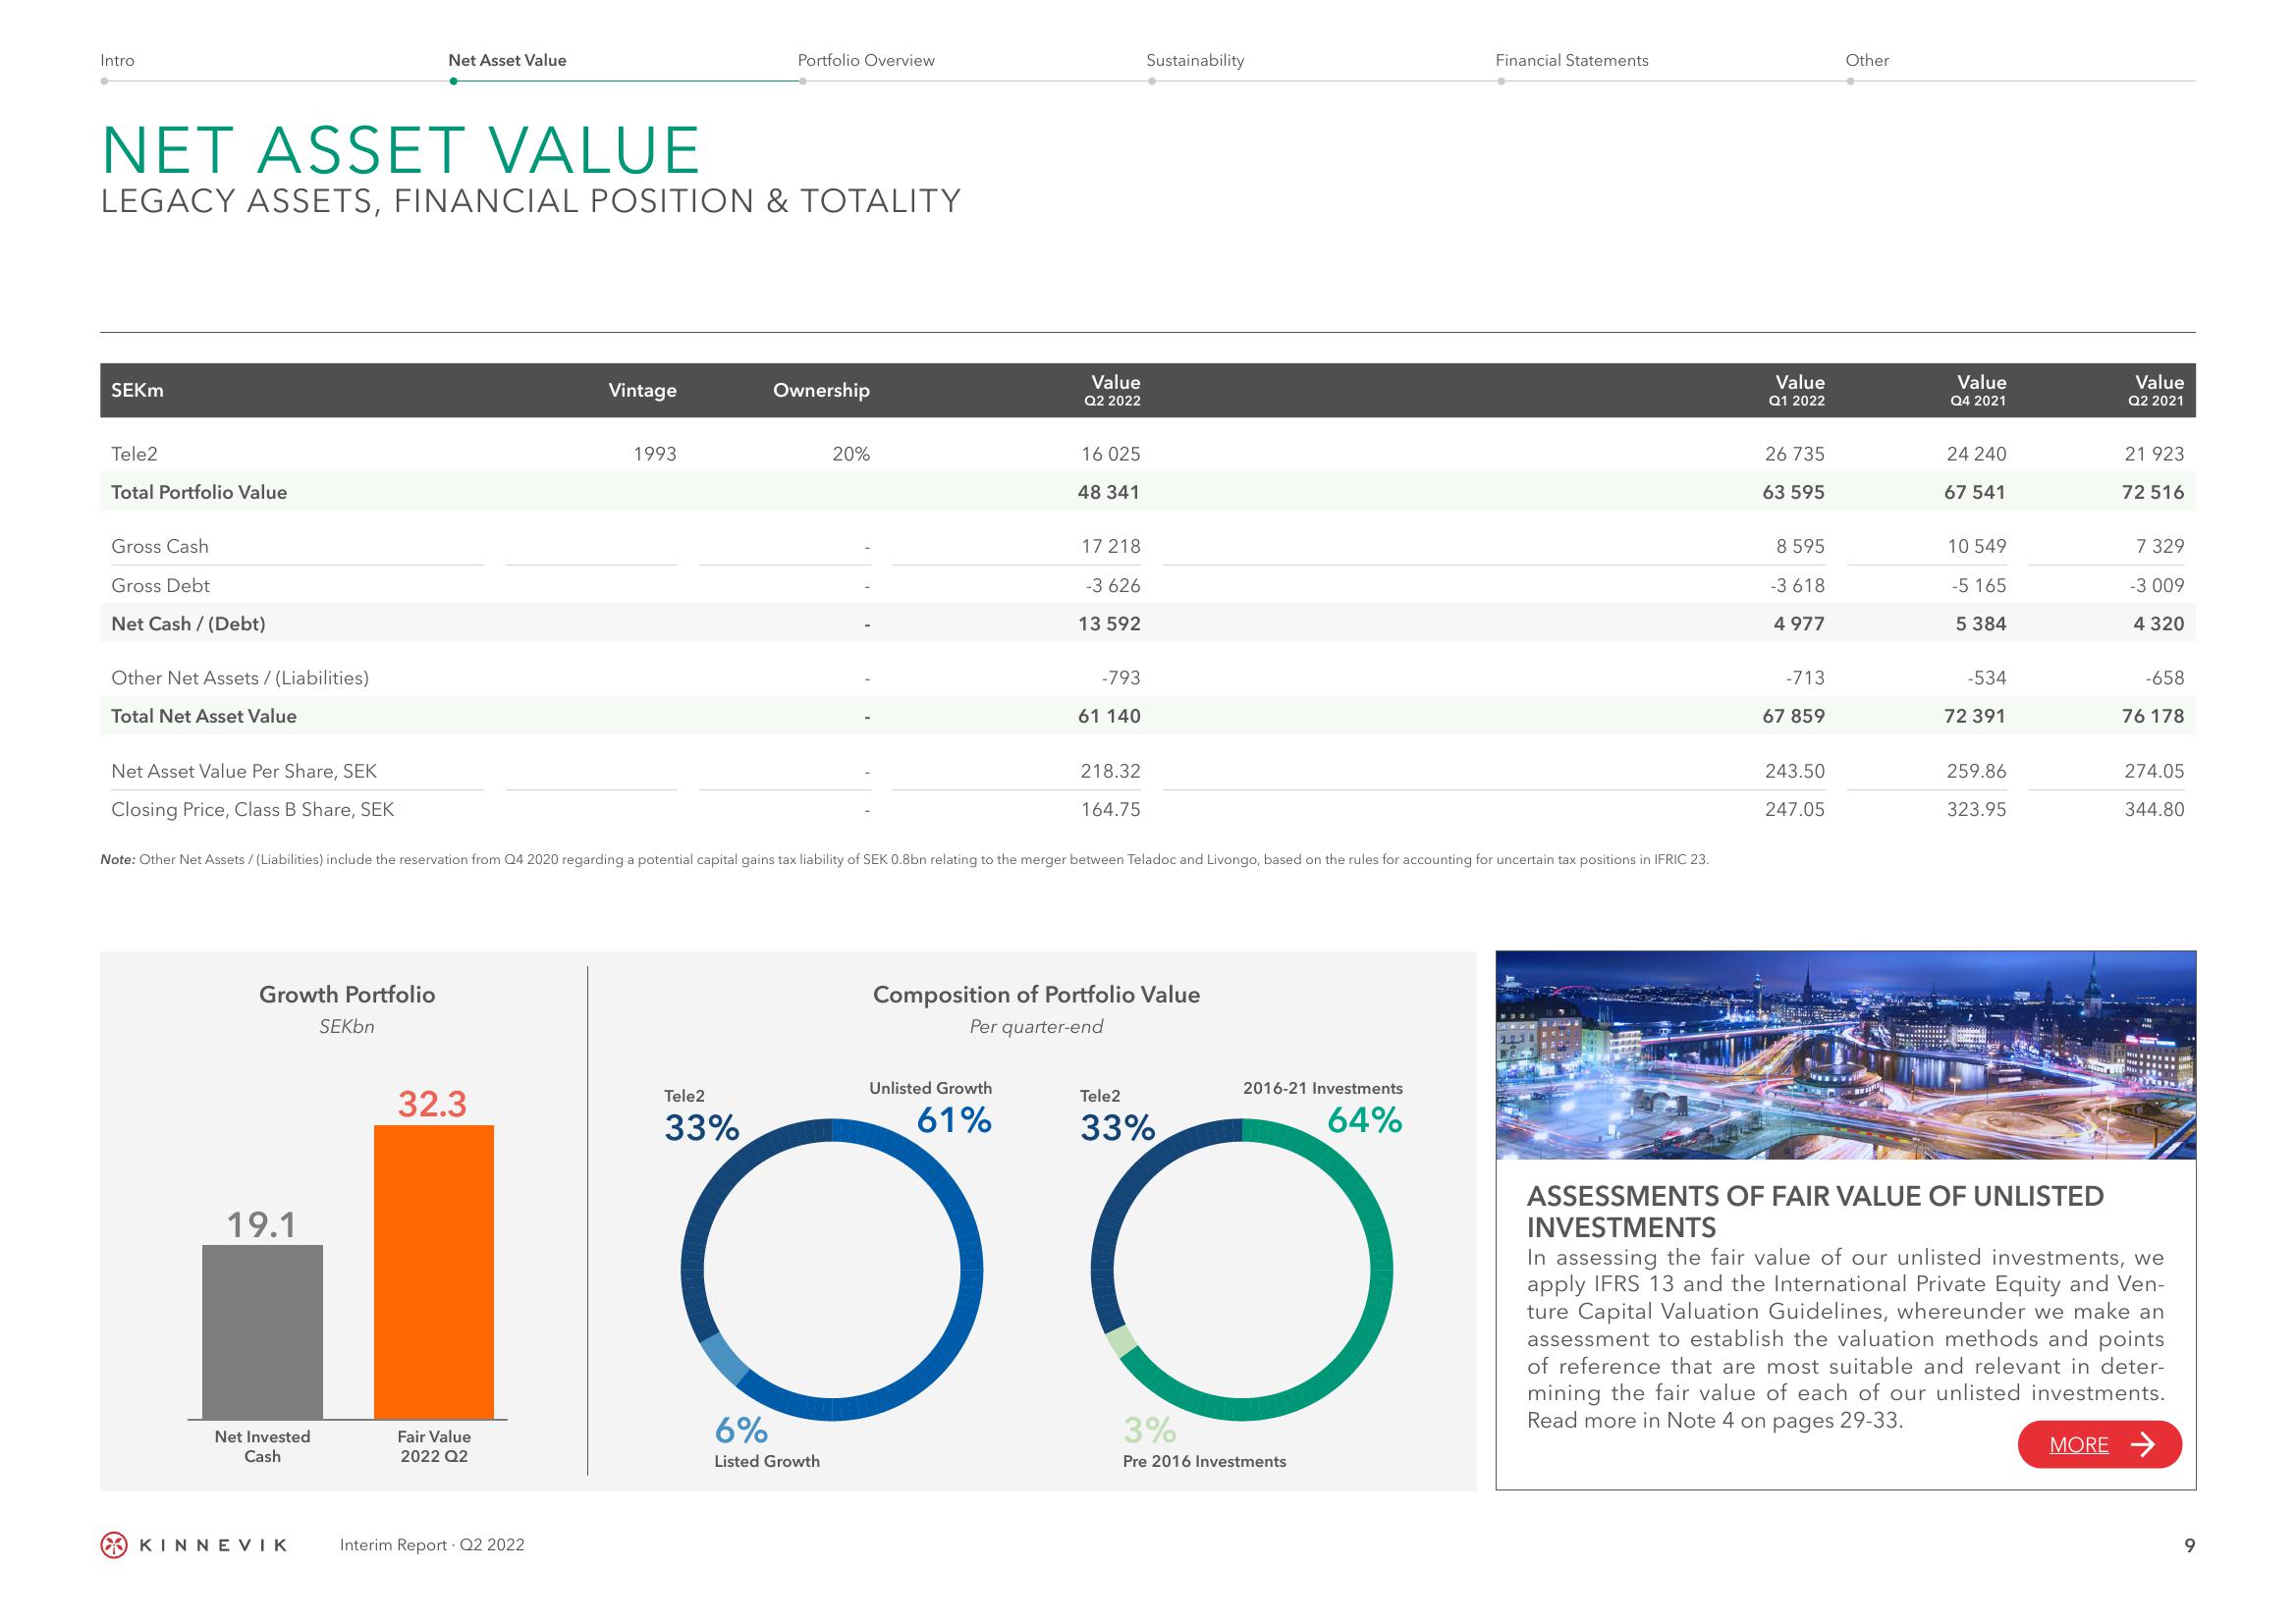
Tele2
Total Portfolio Value
Gross Cash
Gross Debt
Net Cash / (Debt)
Other Net Assets/(Liabilities)
Total Net Asset Value
Net Asset Value Per Share, SEK
Closing Price, Class B Share, SEK
Note:
Growth Portfolio
19.1
Net Invested
Cash
Net Asset Value
KINNEVIK
SEKbn
32.3
Fair Value
2022 Q2
Vintage
Interim Report Q2 2022
1993
Portfolio Overview
Tele2
33%
Ownership
tAssets/(Liabilities) include the reservation from Q4 2020 regarding a potential capital gains tax liability of SEK 0.8bn relating to the merger between Teladoc and Livongo, based on the rules for accounting for uncertain tax positions in IFRIC 23.
20%
6%
Listed Growth
Value
Q2 2022
16 025
48 341
Unlisted Growth
61%
)
17 218
-3 626
13 592
-793
61 140
218.32
164.75
Sustainability
Composition of Portfolio Value
Per quarter-end
Tele2
33%
2016-21 Investments
64%
Financial Statements
3%
Pre 2016 Investments
Value
Q1 2022
26 735
63 595
8 595
-3
618
4 977
-713
67 859
243.50
247.05
Other
Value
Q4 2021
24 240
67 541
10 549
-5 165
5 384
-534
72 391
259.86
323.95
ASSESSMENTS OF FAIR VALUE OF UNLISTED
INVESTMENTS
Value
Q2 2021
21
72 516
7 329
-3 009
4 320
-658
76 178
274.05
344.80
In assessing the fair value of our unlisted investments, we
apply IFRS 13 and the International Private Equity and Ven-
ture Capital Valuation Guidelines, whereunder we make an
assessment to establish the valuation methods and points
of reference that are most suitable and relevant in deter-
mining the fair value of each of our unlisted investments.
Read more in Note 4 on pages 29-33.
MORE →
9View entire presentation