Inovalon Results Presentation Deck
Seasonality Trends - Revenue
inovalon
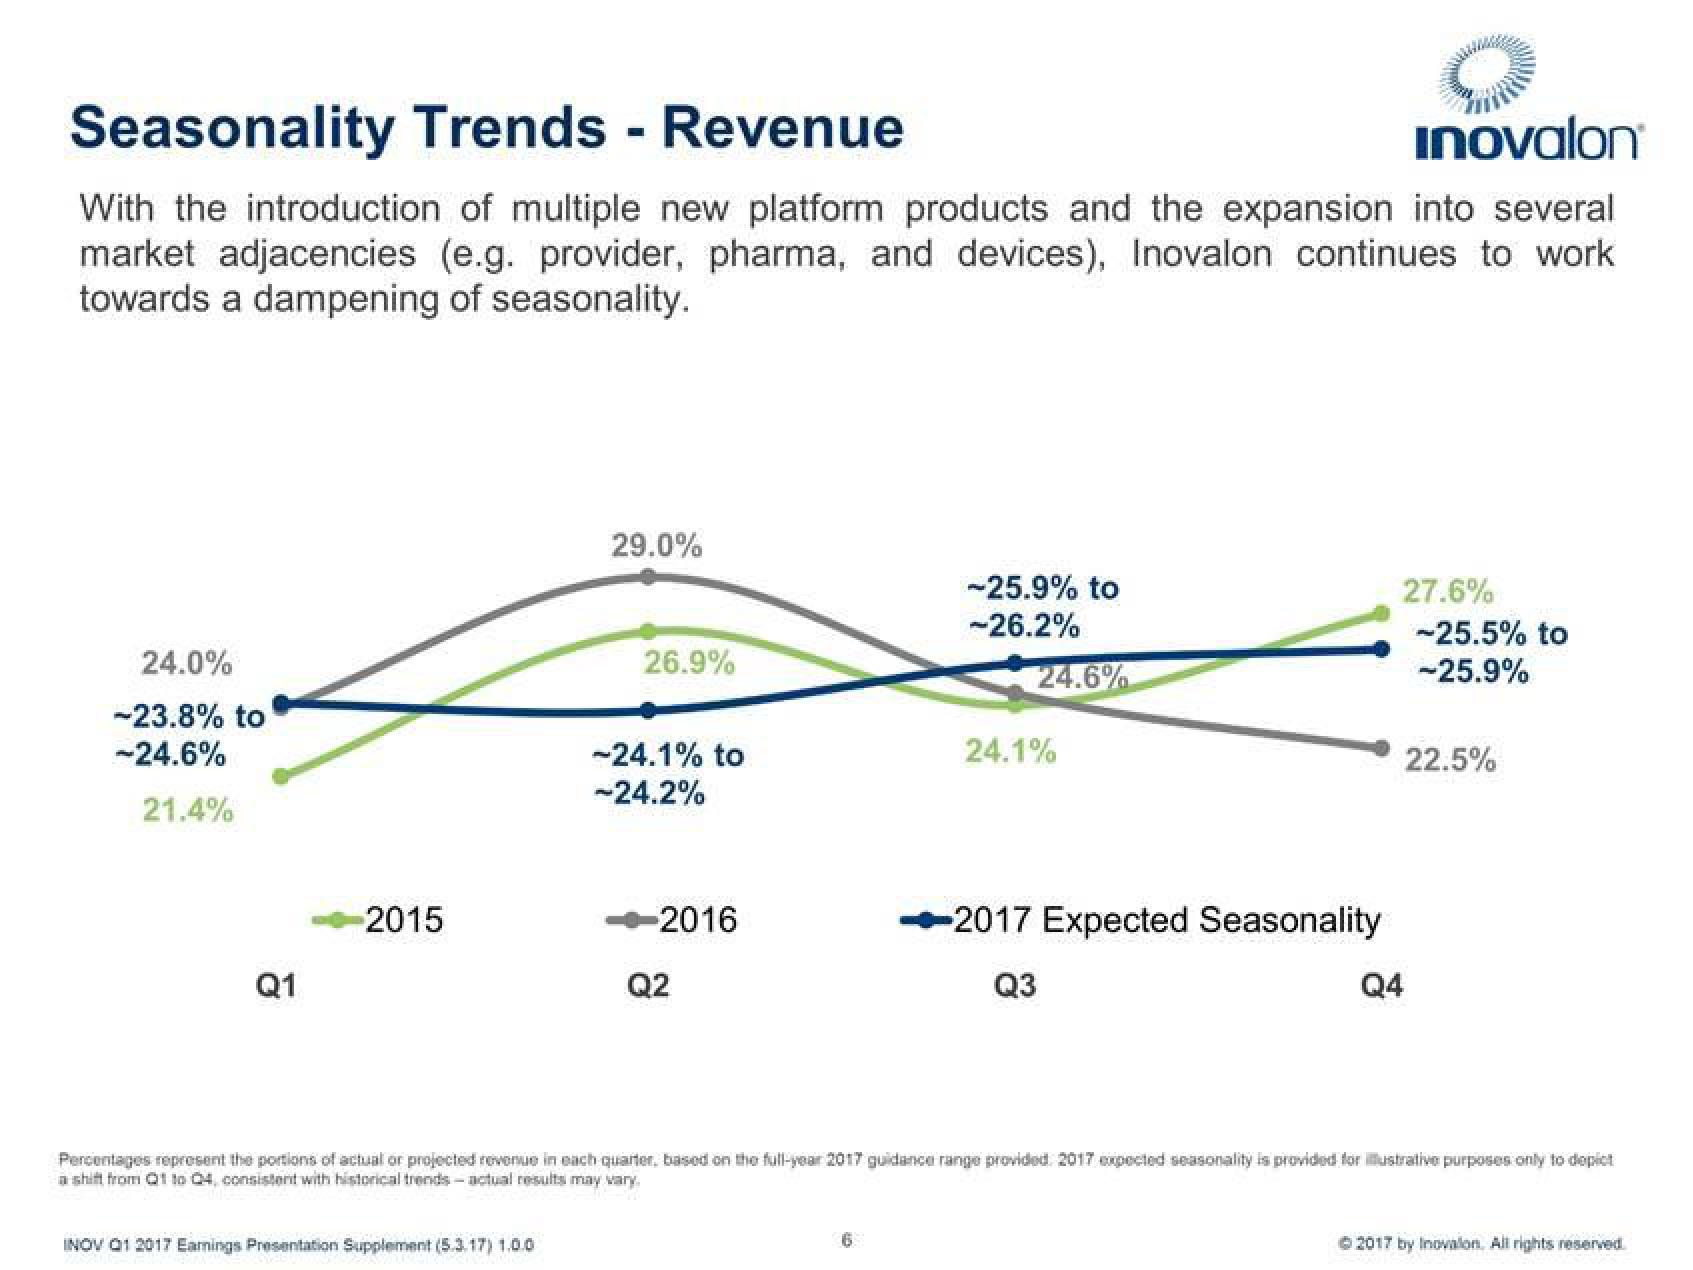
With the introduction of multiple new platform products and the expansion into several
market adjacencies (e.g. provider, pharma, and devices), Inovalon continues to work
towards a dampening of seasonality.
24.0%
-23.8% to
-24.6%
21.4%
Q1
2015
29.0%
INOV 01 2017 Earnings Presentation Supplement (5.3.17) 1.0.0
26.9%
-24.1% to
-24.2%
-2016
Q2
-25.9% to
-26.2%
6
24.6%
24.1%
2017 Expected Seasonality
Q3
27.6%
-25.5% to
-25.9%
Q4
Percentages represent the portions of actual or projected revenue in each quarter, based on the full-year 2017 guidance range provided 2017 expected seasonality is provided for illustrative purposes only to depict
a shift from 01 to 04, consistent with historical trends-actual results may vary.
22.5%
© 2017 by Inovalon. All rights reservedView entire presentation