Snowflake Results Presentation Deck slide image

Snowflake Results Presentation Deck

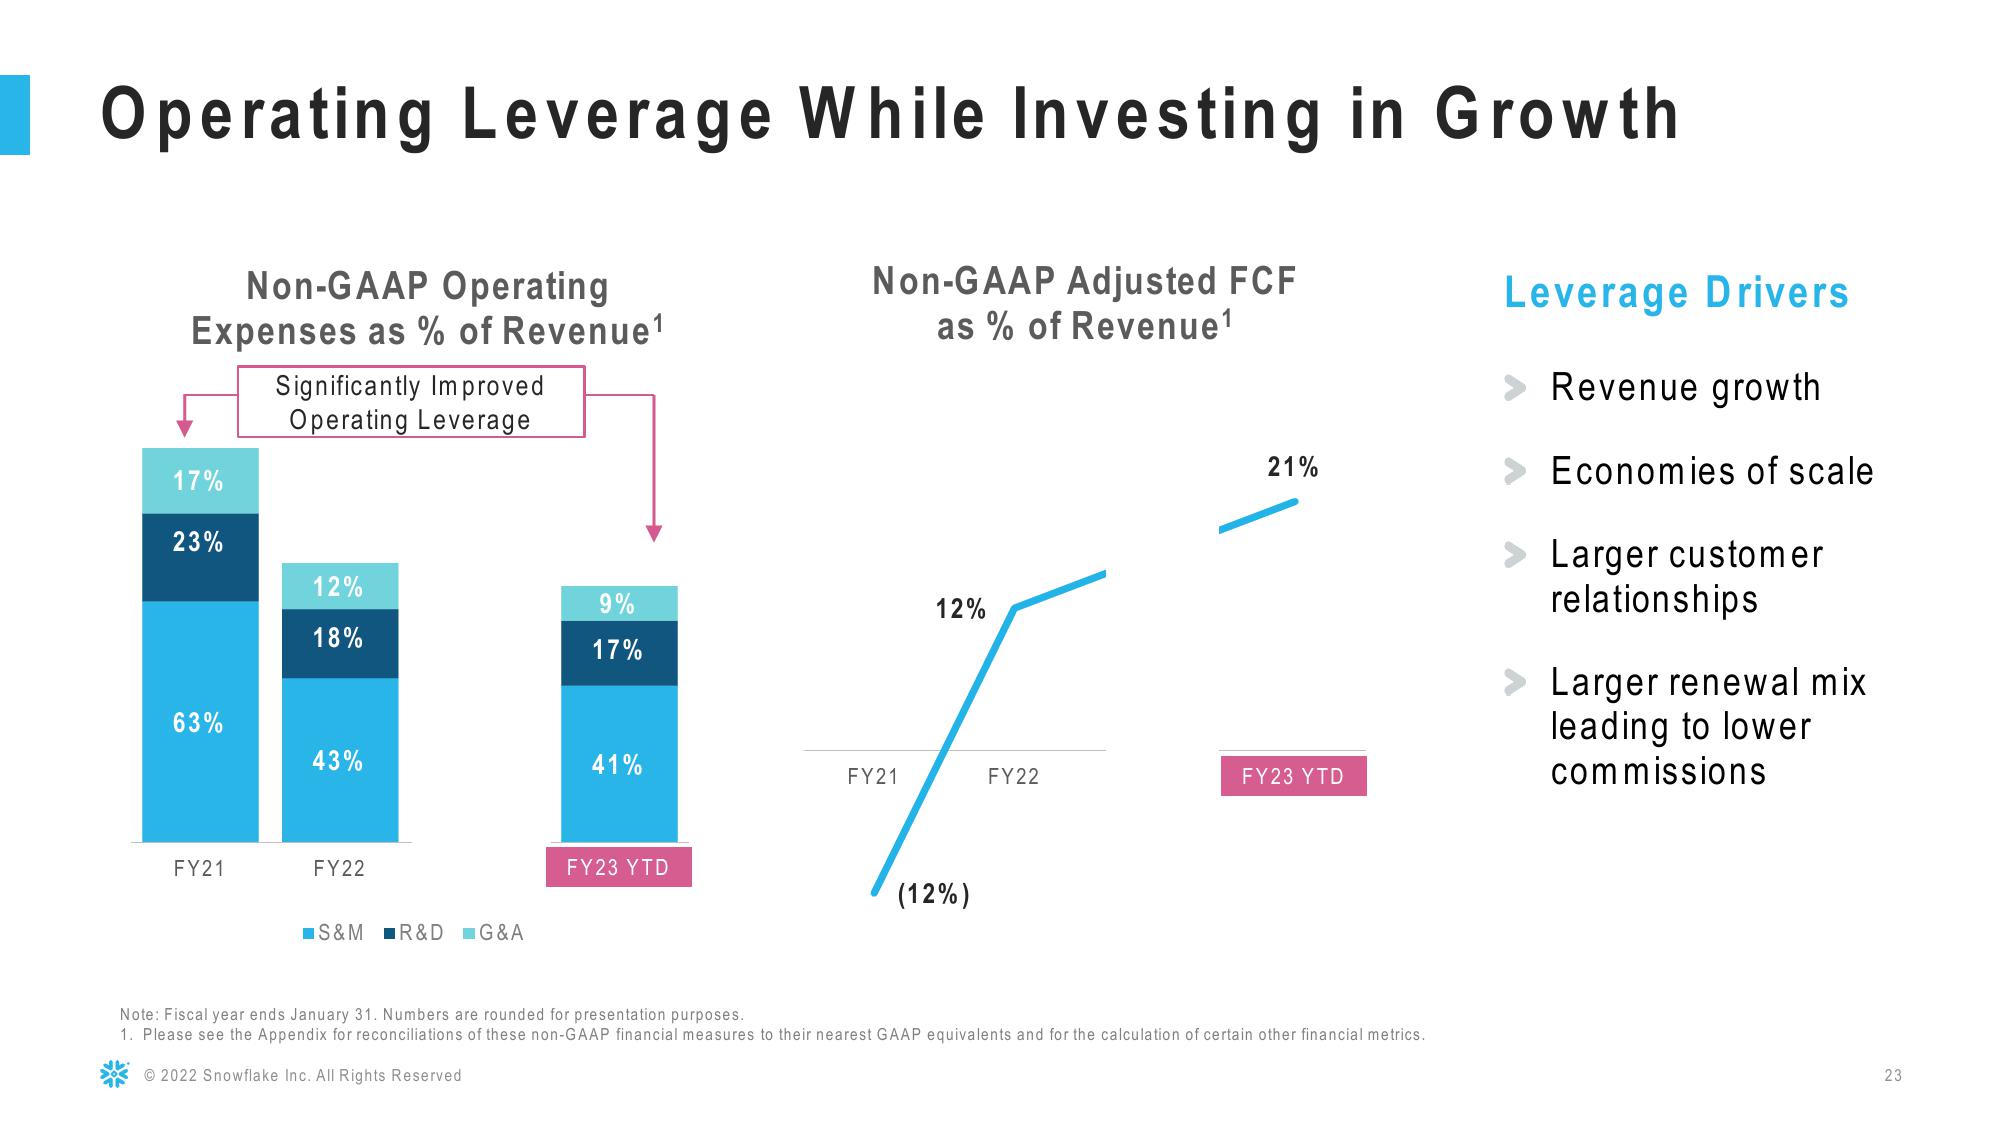
Operating Leverage While Investing in Growth Non-GAAP Adjusted FCF as % of Revenue ¹ Non-GAAP Operating Expenses as % of Revenue¹ Significantly Improved Operating Leverage 17% 23% 63% FY21 12% 18% 43% FY22 S&M R&D =G&A 9% 17% 41% FY23 YTD FY21 12% (12%) FY22 21% FY23 YTD Note: Fiscal year ends January 31. Numbers are rounded for presentation purposes. 1. Please see the Appendix for reconciliations of these non-GAAP financial measures to their nearest GAAP equivalents and for the calculation of certain other financial metrics. Ⓒ2022 Snowflake Inc. All Rights Reserved Leverage Drivers Revenue growth Economies of scale Larger customer relationships Larger renewal mix leading to lower commissions 23
View entire presentation