TPG Results Presentation Deck
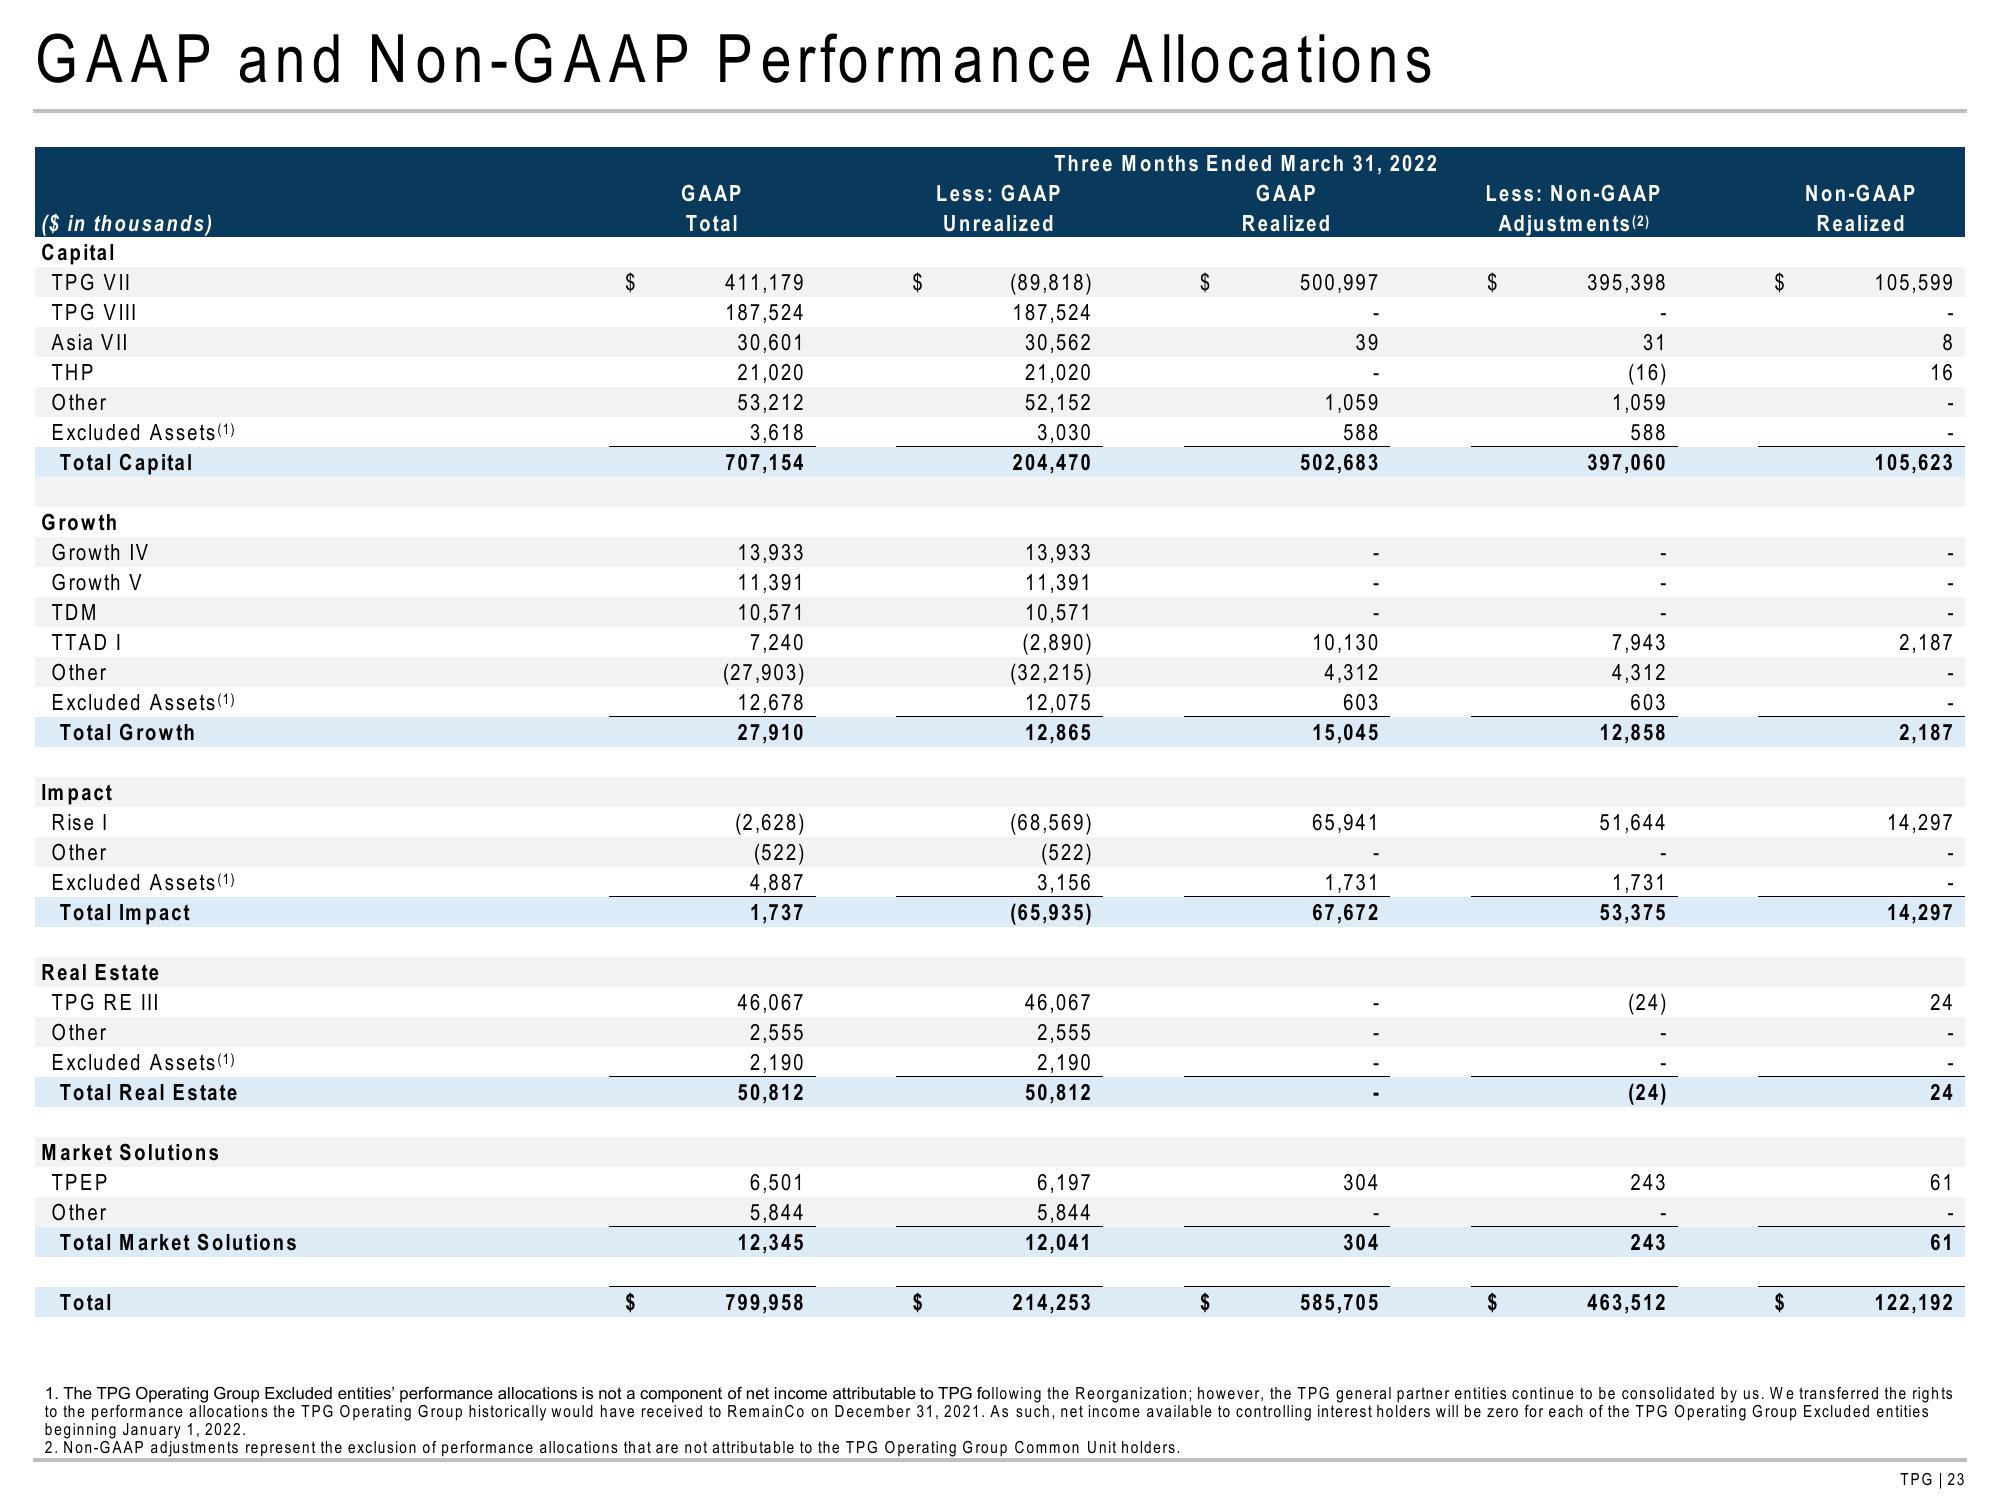
GAAP and Non-GAAP Performance Allocations
Three Months Ended March 31, 2022
GAAP
Realized
($ in thousands)
Capital
TPG VII
TPG VIII
Asia VII
THP
Other
Excluded Assets (1)
Total Capital
Growth
Growth IV
Growth V
TDM
TTAD I
Other
Excluded Assets (1)
Total Growth
Impact
Rise I
Other
Excluded Assets (1)
Total Impact
Real Estate
TPG RE III
Other
Excluded Assets (1)
Total Real Estate
Market Solutions
TPEP
Other
Total Market Solutions
Total
$
$
GAAP
Total
411,179
187,524
30,601
21,020
53,212
3,618
707,154
13,933
11,391
10,571
7,240
(27,903)
12,678
27,910
(2,628)
(522)
4,887
1,737
46,067
2,555
2,190
50,812
6,501
5,844
12,345
799,958
$
$
Less: GAAP
Unrealized
(89,818)
187,524
30,562
21,020
52,152
3,030
204,470
13,933
11,391
10,571
(2,890)
(32,215)
12,075
12,865
(68,569)
(522)
3,156
(65,935)
46,067
2,555
2,190
50,812
6,197
5,844
12,041
214,253
$
$
500,997
39
1,059
588
502,683
10,130
4,312
603
15,045
65,941
1,731
67,672
304
304
585,705
Less: Non-GAAP
Adjustments (2)
$
395,398
31
(16)
1,059
588
397,060
7,943
4,312
603
12,858
51,644
1,731
53,375
(24)
(24)
243
243
463,512
$
$
Non-GAAP
Realized
105,599
8
16
105,623
2,187
2,187
14,297
14,297
24
24
61
61
122,192
1. The TPG Operating Group Excluded entities' performance allocations is not a component of net income attributable to TPG following the Reorganization; however, the TPG general partner entities continue to be consolidated by us. We transferred the rights
to the performance allocations the TPG Operating Group historically would have received to RemainCo on December 31, 2021. As such, net income available to controlling interest holders will be zero for each of the TPG Operating Group Excluded entities
beginning January 1, 2022.
2. Non-GAAP adjustments represent the exclusion of performance allocations that are not attributable to the TPG Operating Group Common Unit holders.
TPG | 23View entire presentation