First Busey Results Presentation Deck
2Q23 Earnings Investor Presentation
1
FirsTech
■
■
■
■
■
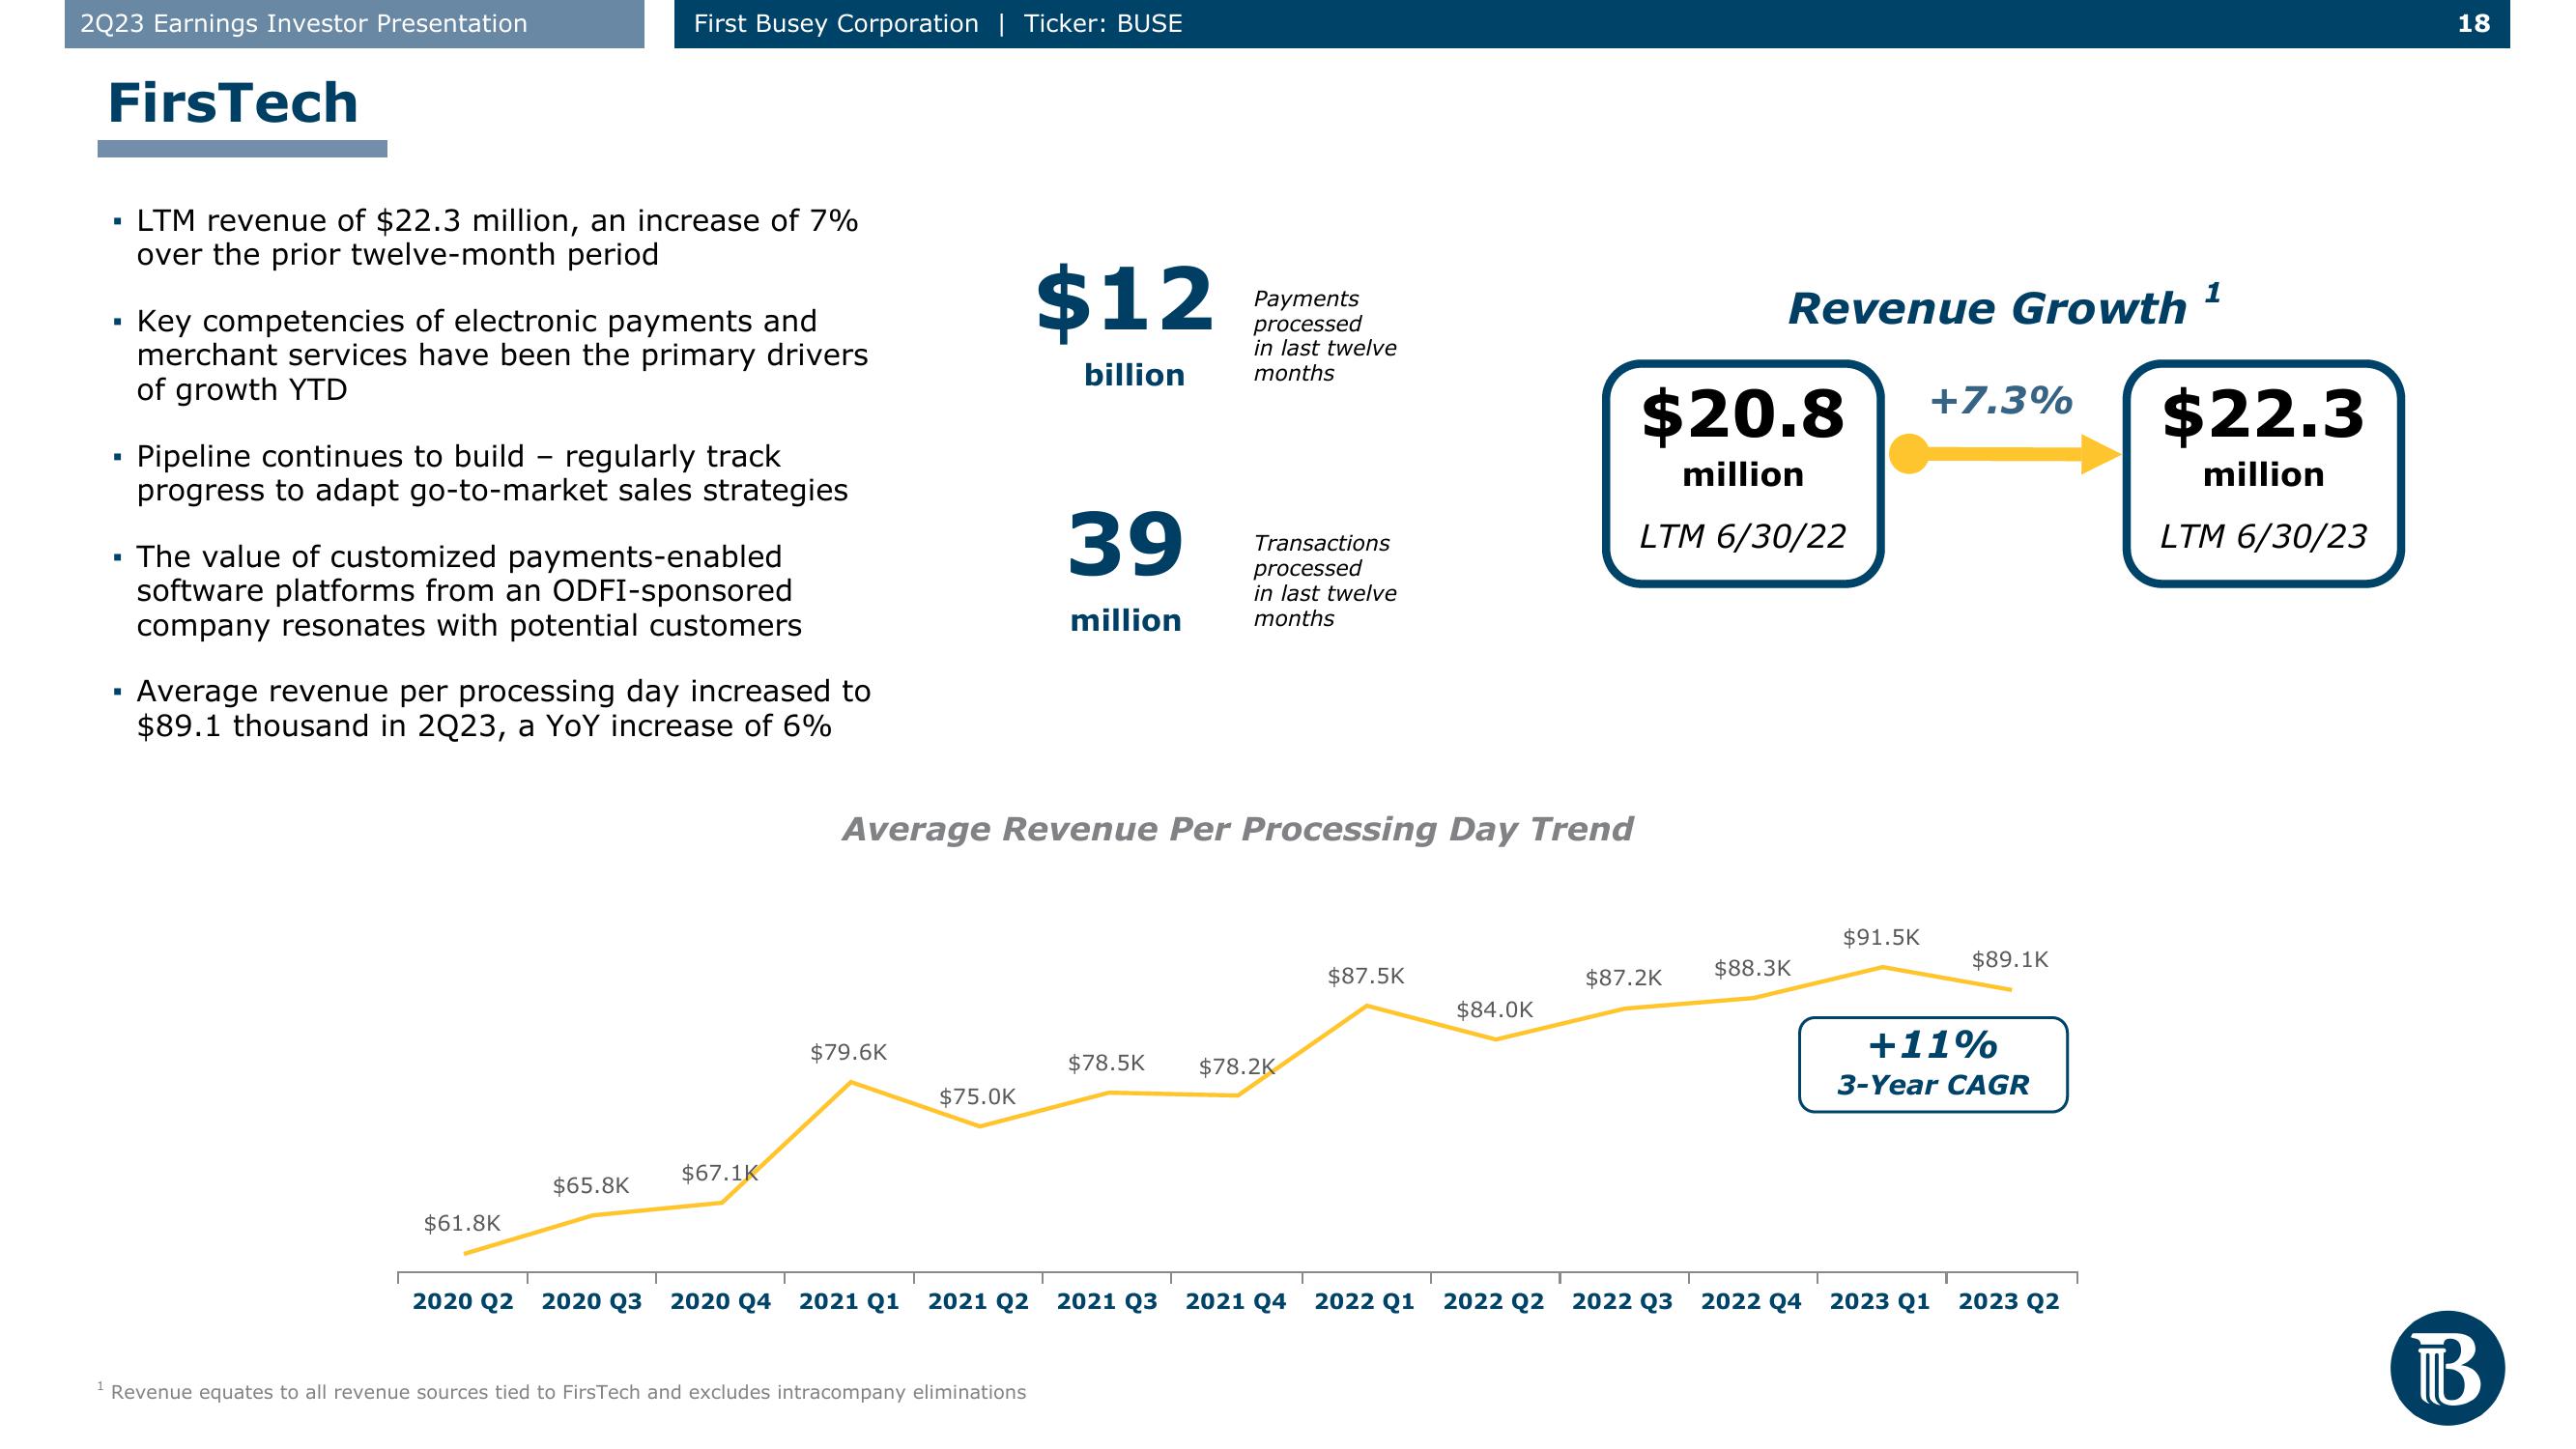
LTM revenue of $22.3 million, an increase of 7%
over the prior twelve-month period
First Busey Corporation | Ticker: BUSE
Key competencies of electronic payments and
merchant services have been the primary drivers
of growth YTD
Pipeline continues to build - regularly track
progress to adapt go-to-market sales strategies
The value of customized payments-enabled
software platforms from an ODFI-sponsored
company resonates with potential customers
Average revenue per processing day increased to
$89.1 thousand in 2Q23, a YoY increase of 6%
$61.8K
$65.8K
$67.1K
$79.6K
$75.0K
2020 Q2 2020 Q3 2020 Q4 2021 Q1 2021 Q2
$12
billion
Average Revenue Per Processing Day Trend
Revenue equates to all revenue sources tied to FirsTech and excludes intracompany eliminations
39
million
Payments
processed
in last twelve
months
Transactions
processed
in last twelve
months
$78.5K $78.2K
$87.5K
2021 Q3 2021 Q4 2022 Q1
$84.0K
2022 Q2
Revenue Growth
$20.8
million
LTM 6/30/22
$87.2K
$88.3K
2022 Q3 2022 Q4
$91.5K
+7.3%
$89.1K
+11%
3-Year CAGR
2023 Q1 2023 Q2
1
$22.3
million
LTM 6/30/23
18
BView entire presentation