AngloAmerican Results Presentation Deck
PRODUCTION OUTLOOK - SUPPLEMENTARY GUIDANCE
Copper²
Platinum Group Metals - M&C by
metal³
Platinum Group Metals - Refined Ⓡ
Iron ore (Kumba)⁹
Iron ore (Minas-Rio) ¹0
Thermal coal6
1.
2.
3.
4.
5.
6.
7.
8.
Units
kt
Moz
Anglo American
Moz
Mt
Mt
Mt
2019
638
4.4
4.7
42
23
South Africa: 18
Colombia: 8
2020
647
Pt: 1.8
Pd: 1.2
Other: 0.8
2.7
37
24
South Africa: 16.5
Colombia: 4
2021F
640-680
Pt: 1.9-2.1
Pd: 1.4-1.5
Other: 0.9-1.0
4.6-5.0
40-41
24-26
South Africa: ~16
Colombia: 8
2022F
Chile: 580-640
Peru: 100-150
Pt: 1.9-2.1
Pd: 1.4-1.5
Other: 0.9-1.0
4.7-5.1
41-42
24-26
South Africa: -16
Colombia: 8
2023F (New)
Chile: 590-650
Peru: 300-350
Pt: 1.9-2.1
Pd: 1.4-1.5
Other: 0.9-1.0
4.2-4.6
41-42
25-27
South Africa: -16
Colombia: 8
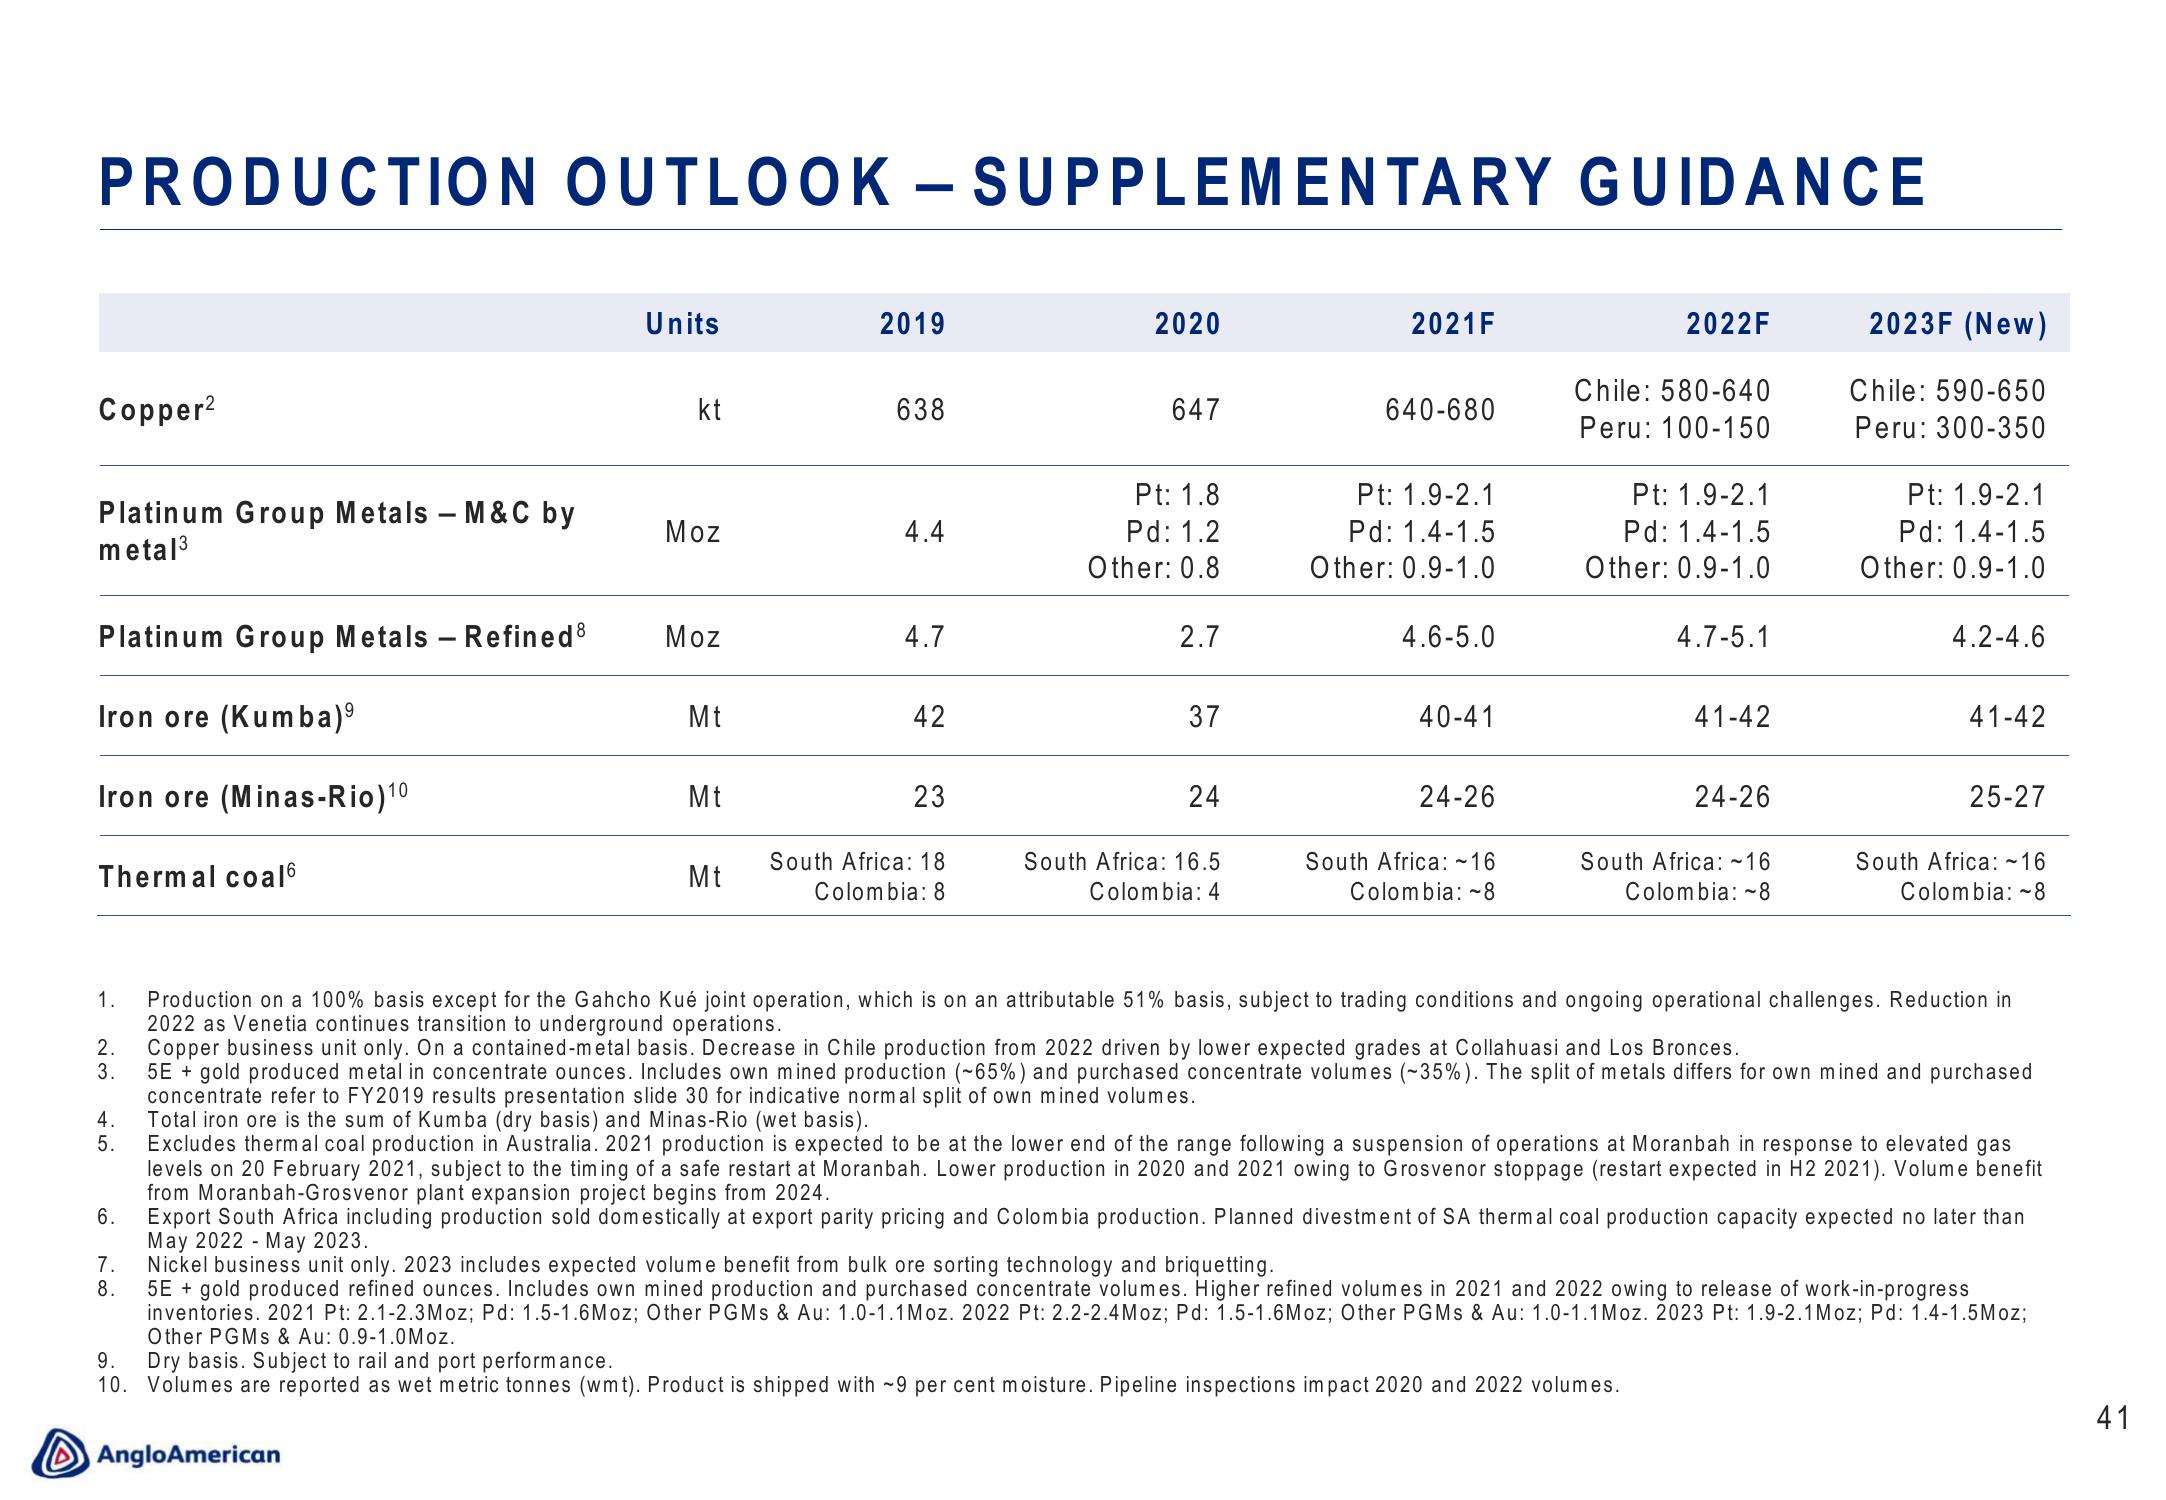
Production on a 100% basis except for the Gahcho Kué joint operation, which is on an attributable 51% basis, subject to trading conditions and ongoing operational challenges. Reduction in
2022 as Venetia continues transition to underground operations.
Total iron ore is the sum of Kumba (dry basis) and Minas-Rio (wet basis).
Excludes thermal coal production in Australia. 2021 production is expected to be at the lower end of the range following a suspension of operations at Moranbah in response to elevated gas
levels on 20 February 2021, subject to the timing of a safe restart at Moranbah. Lower production in 2020 and 2021 owing to Grosvenor stoppage (restart expected in H2 2021). Volume benefit
from Moranbah-Grosvenor plant expansion project begins from 2024.
Export South Africa including production sold domestically at export parity pricing and Colombia production. Planned divestment of SA thermal coal production capacity expected no later than
May 2022 - May 2023.
Nickel business unit only. 2023 includes expected volume benefit from bulk ore sorting technology and briquetting.
5E + gold produced refined ounces. Includes own mined production and purchased concentrate volumes. Higher refined volumes in 2021 and 2022 owing to release of work-in-progress
inventories. 2021 Pt: 2.1-2.3 Moz; Pd: 1.5-1.6Moz; Other PGMs & Au: 1.0-1.1 Moz. 2022 Pt: 2.2-2.4Moz; Pd: 1.5-1.6Moz; Other PGMs & Au: 1.0-1.1 Moz. 2023 Pt: 1.9-2.1 Moz; Pd: 1.4-1.5Moz;
Other PGMs & Au: 0.9-1.0Moz.
Dry basis. Subject to rail and port performance.
9.
10. Volumes are reported as wet metric tonnes (wmt). Product is shipped with ~9 per cent moisture. Pipeline inspections impact 2020 and 2022 volumes.
Copper business unit only. On a contained-metal basis. Decrease in Chile production from 2022 driven by lower expected grades at Collahuasi and Los Bronces.
5E + gold produced metal in concentrate ounces. Includes own mined production (~65%) and purchased concentrate volumes (~35%). The split of metals differs for own mined and purchased
concentrate refer to FY2019 results presentation slide 30 for indicative normal split of own mined volumes.
41View entire presentation