Tesla Results Presentation Deck
29
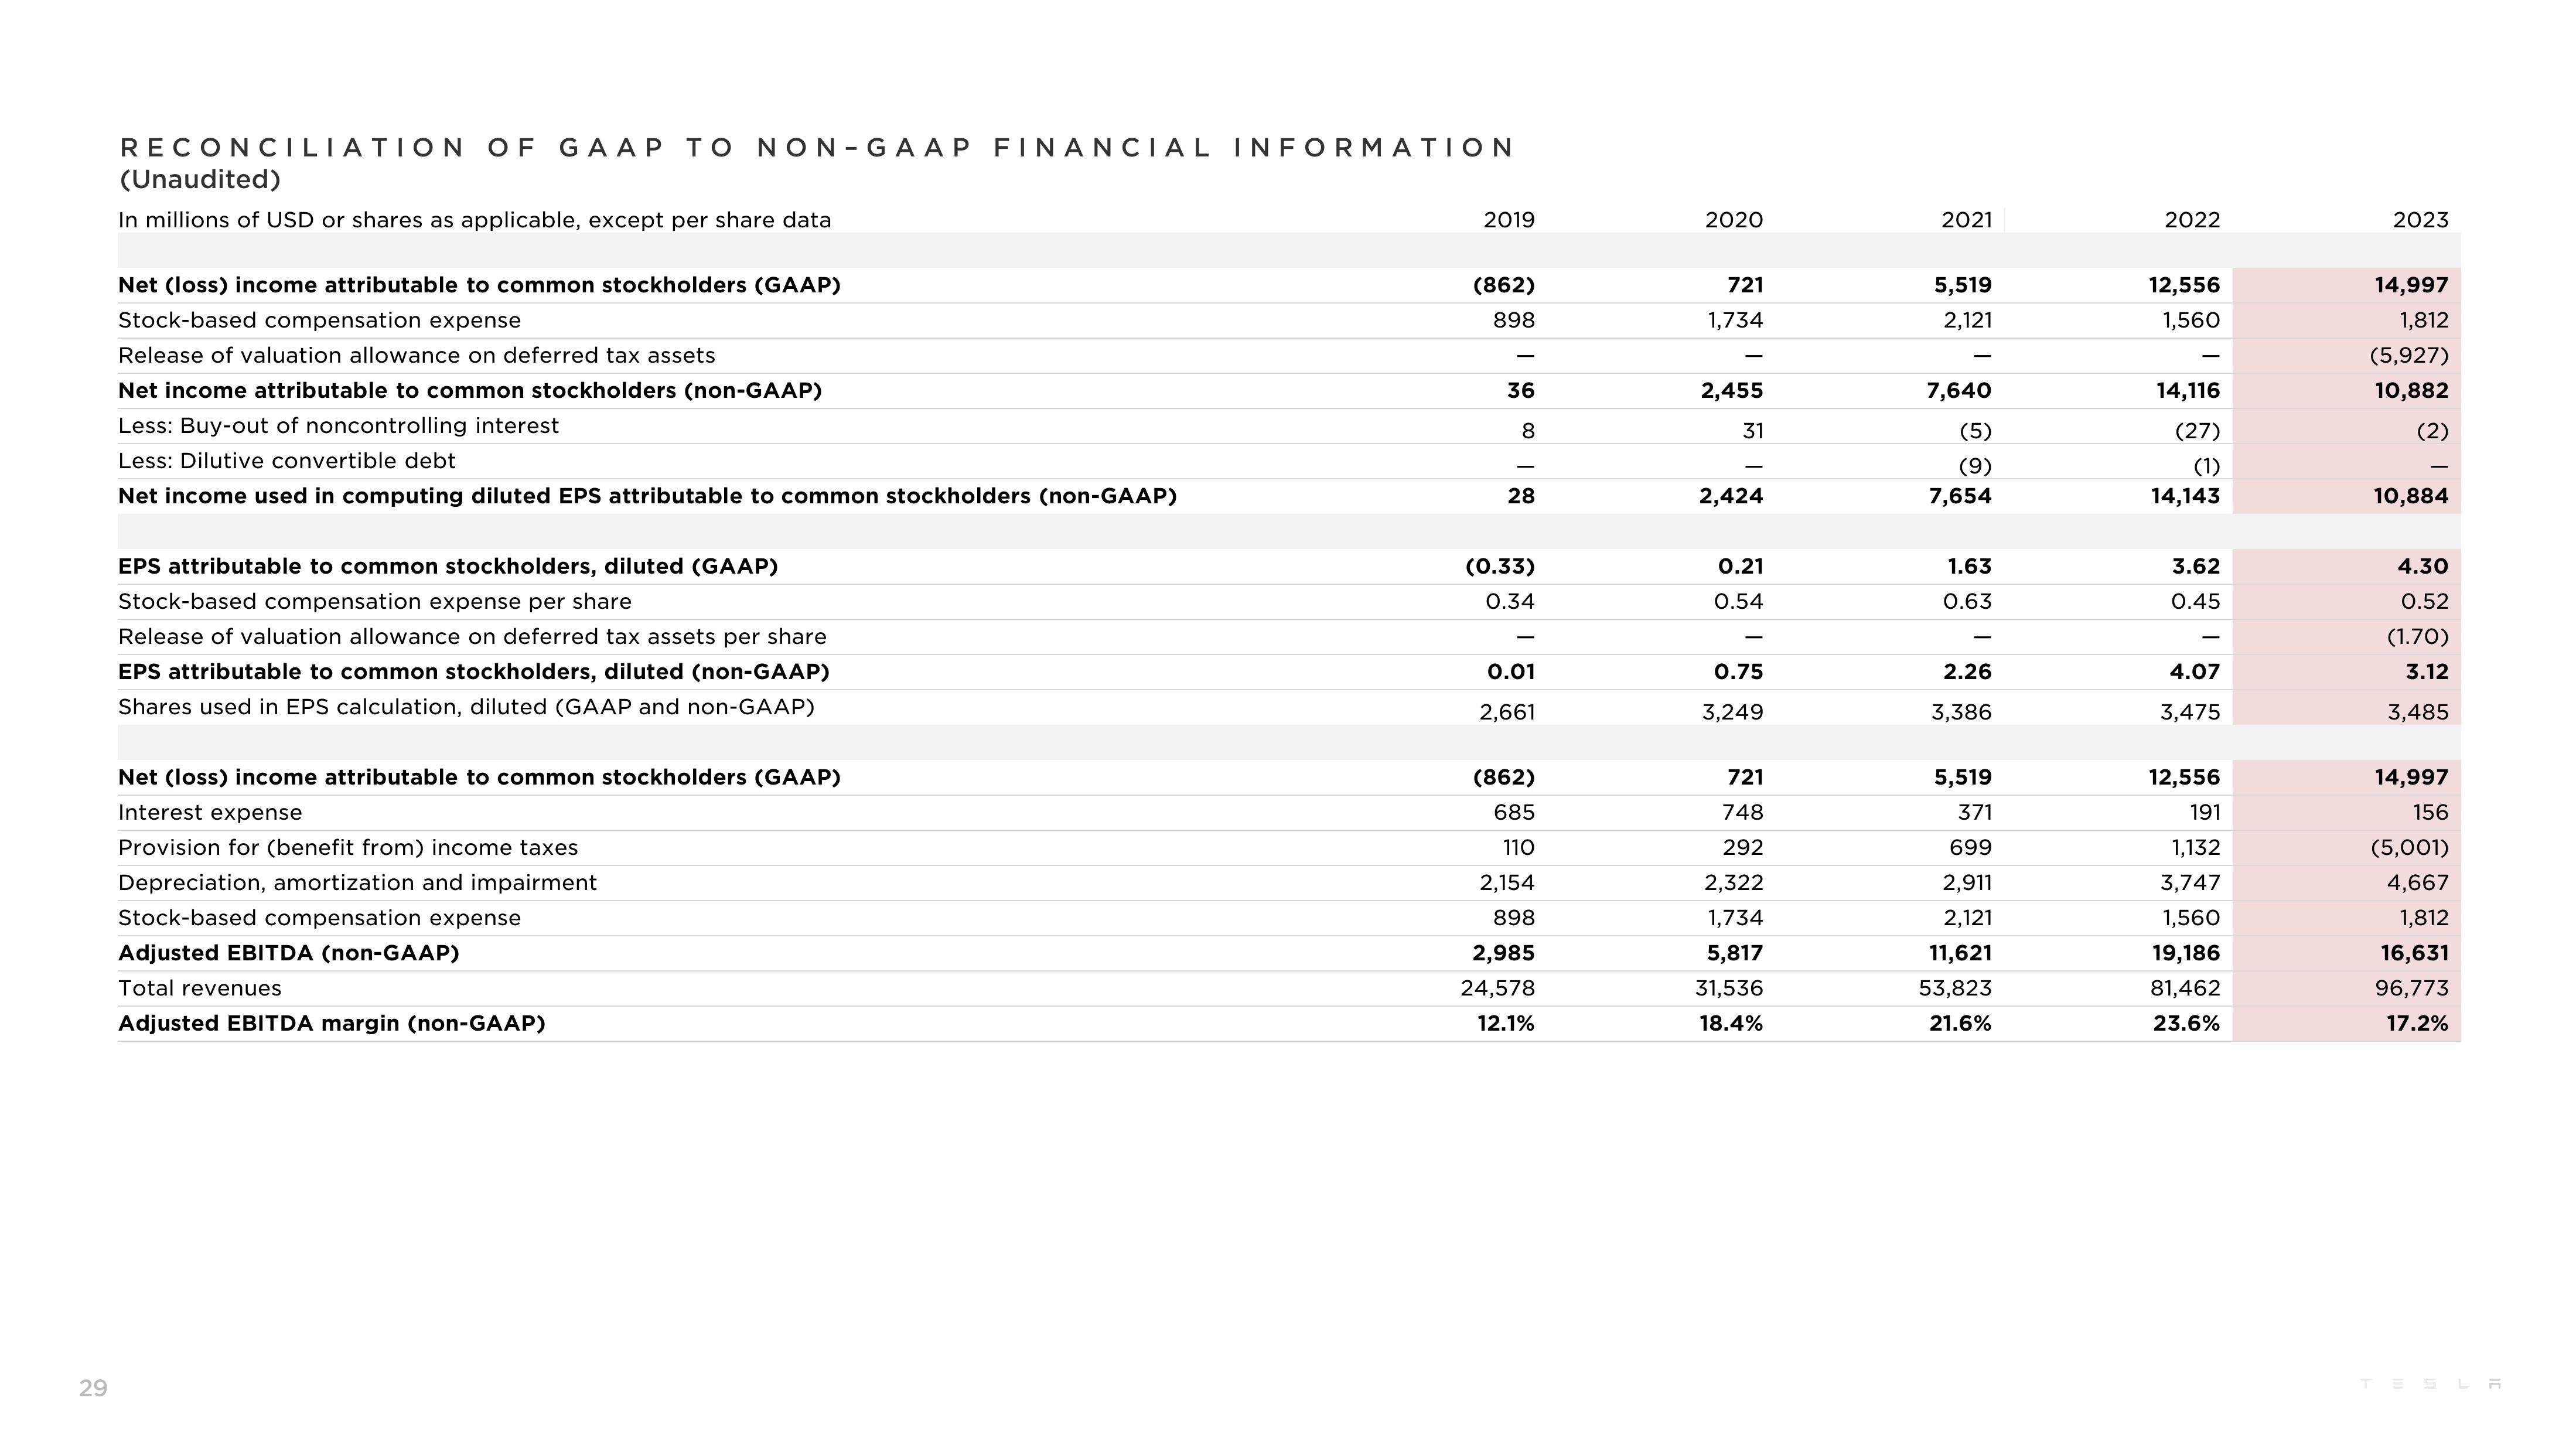
RECONCILIATION OF GAAP TO NON-GAAP FINANCIAL INFORMATION
(Unaudited)
In millions of USD or shares as applicable, except per share data
Net (loss) income attributable to common stockholders (GAAP)
Stock-based compensation expense
Release of valuation allowance on deferred tax assets
Net income attributable to common stockholders (non-GAAP)
Less: Buy-out of noncontrolling interest
Less: Dilutive convertible debt
Net income used in computing diluted EPS attributable to common stockholders (non-GAAP)
EPS attributable to common stockholders, diluted (GAAP)
Stock-based compensation expense per share
Release of valuation allowance on deferred tax assets per share
EPS attributable to common stockholders, diluted (non-GAAP)
Shares used in EPS calculation, diluted (GAAP and non-GAAP)
Net (loss) income attributable to common stockholders (GAAP)
Interest expense
Provision for (benefit from) income taxes
Depreciation, amortization and impairment
Stock-based compensation expense
Adjusted EBITDA (non-GAAP)
Total revenues
Adjusted EBITDA margin (non-GAAP)
2019
(862)
898
36
8
28
(0.33)
0.34
0.01
2,661
(862)
685
110
2,154
898
2,985
24,578
12.1%
2020
721
1,734
2,455
31
-
2,424
0.21
0.54
0.75
3,249
721
748
292
2,322
1,734
5,817
31,536
18.4%
2021
5,519
2,121
7,640
(5)
(9)
7,654
1.63
0.63
2.26
3,386
5,519
371
699
2,911
2,121
11,621
53,823
21.6%
2022
12,556
1,560
14,116
(27)
(1)
14,143
3.62
0.45
4.07
3,475
12,556
191
1,132
3,747
1,560
19,186
81,462
23.6%
2023
14,997
1,812
(5,927)
10,882
(2)
10,884
4.30
0.52
(1.70)
3.12
3,485
14,997
156
(5,001)
4,667
1,812
16,631
96,773
17.2%
TESLAView entire presentation