Avantor Results Presentation Deck
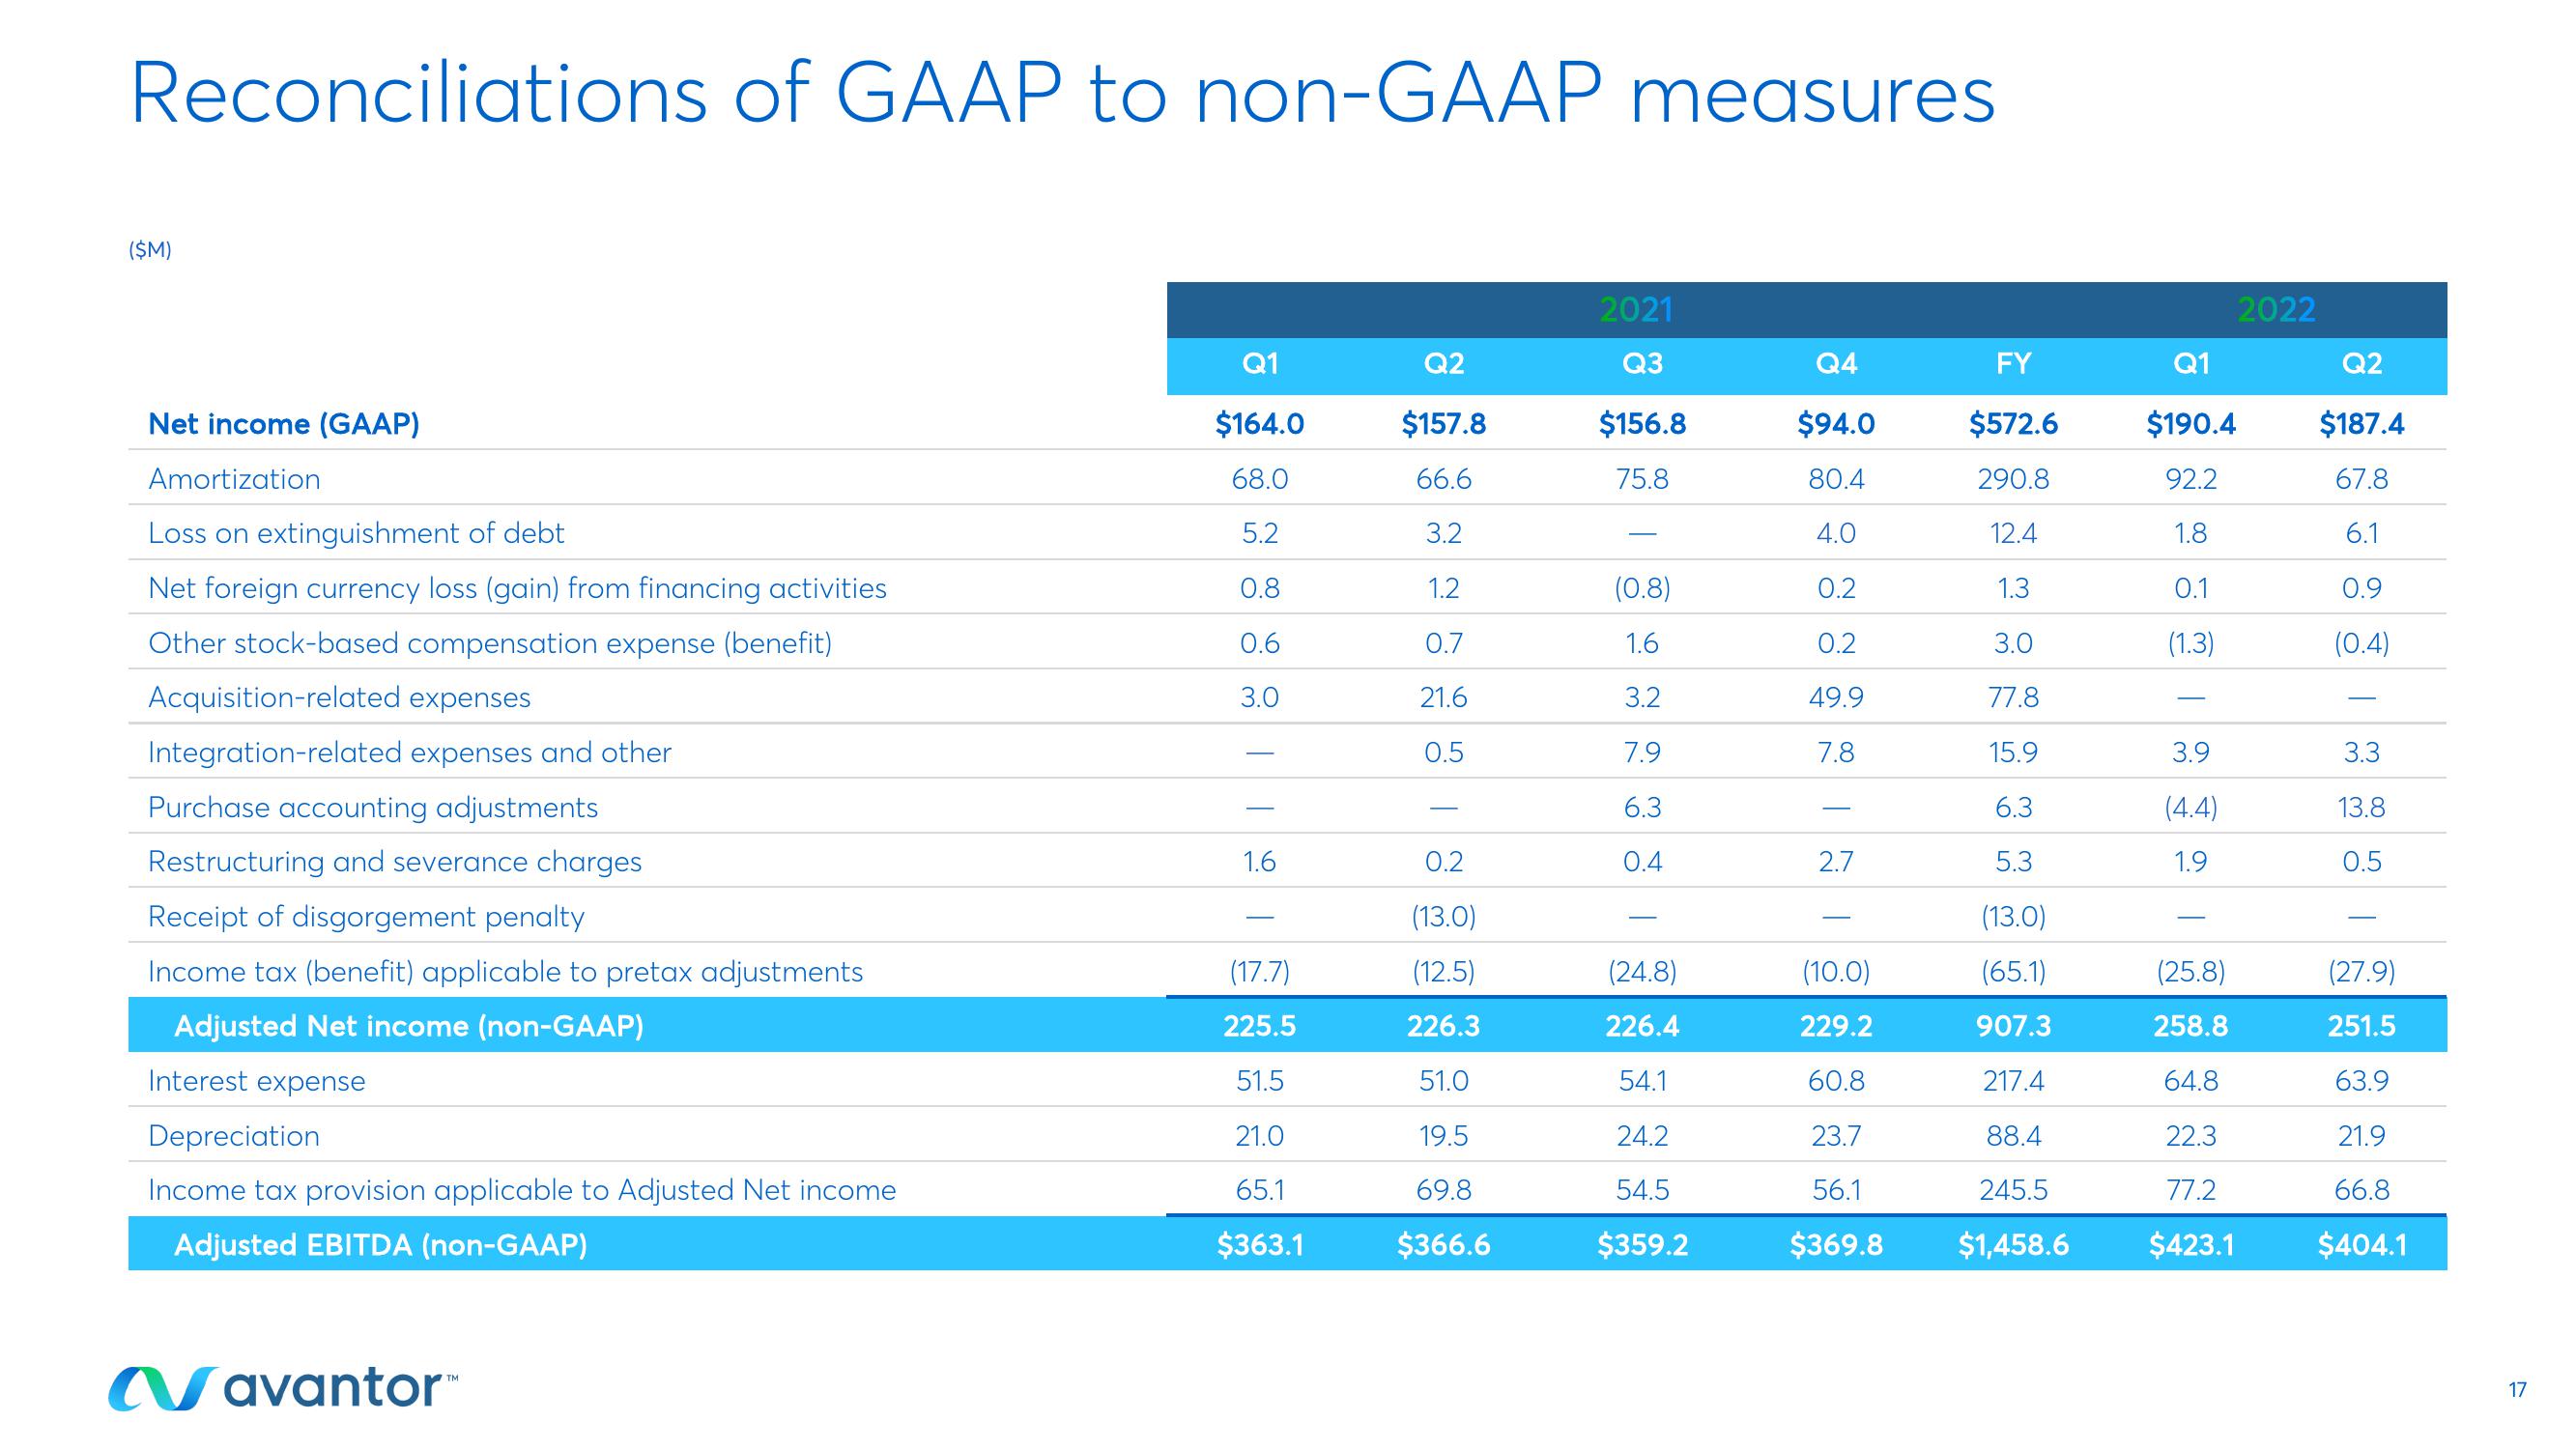
Reconciliations of GAAP to non-GAAP measures
($M)
Net income (GAAP)
Amortization
Loss on extinguishment of debt
Net foreign currency loss (gain) from financing activities
Other stock-based compensation expense (benefit)
Acquisition-related expenses
Integration-related expenses and other
Purchase accounting adjustments
Restructuring and severance charges
Receipt of disgorgement penalty
Income tax (benefit) applicable to pretax adjustments
Adjusted Net income (non-GAAP)
Interest expense
Depreciation
Income tax provision applicable to Adjusted Net income
Adjusted EBITDA (non-GAAP)
Navantor™
Q1
$164.0
68.0
5.2
0.8
0.6
3.0
1.6
(17.7)
225.5
51.5
21.0
65.1
$363.1
Q2
$157.8
66.6
3.2
1.2
0.7
21.6
0.5
0.2
(13.0)
(12.5)
226.3
51.0
19.5
69.8
$366.6
2021
Q3
$156.8
75.8
(0.8)
1.6
3.2
7.9
6.3
0.4
(24.8)
226.4
54.1
24.2
54.5
$359.2
Q4
$94.0
80.4
4.0
0.2
0.2
49.9
7.8
2.7
(10.0)
229.2
60.8
23.7
56.1
$369.8
FY
$572.6
290.8
12.4
1.3
3.0
77.8
15.9
6.3
5.3
(13.0)
(65.1)
907.3
217.4
88.4
245.5
$1,458.6
2022
Q1
$190.4
92.2
1.8
0.1
(1.3)
3.9
(4.4)
1.9
(25.8)
258.8
64.8
22.3
77.2
$423.1
Q2
$187.4
67.8
6.1
0.9
(0.4)
-
3.3
13.8
0.5
(27.9)
251.5
63.9
21.9
66.8
$404.1
17View entire presentation