Maersk Results Presentation Deck
A.P. Moller Maersk Group
- Interim Report 02 2015
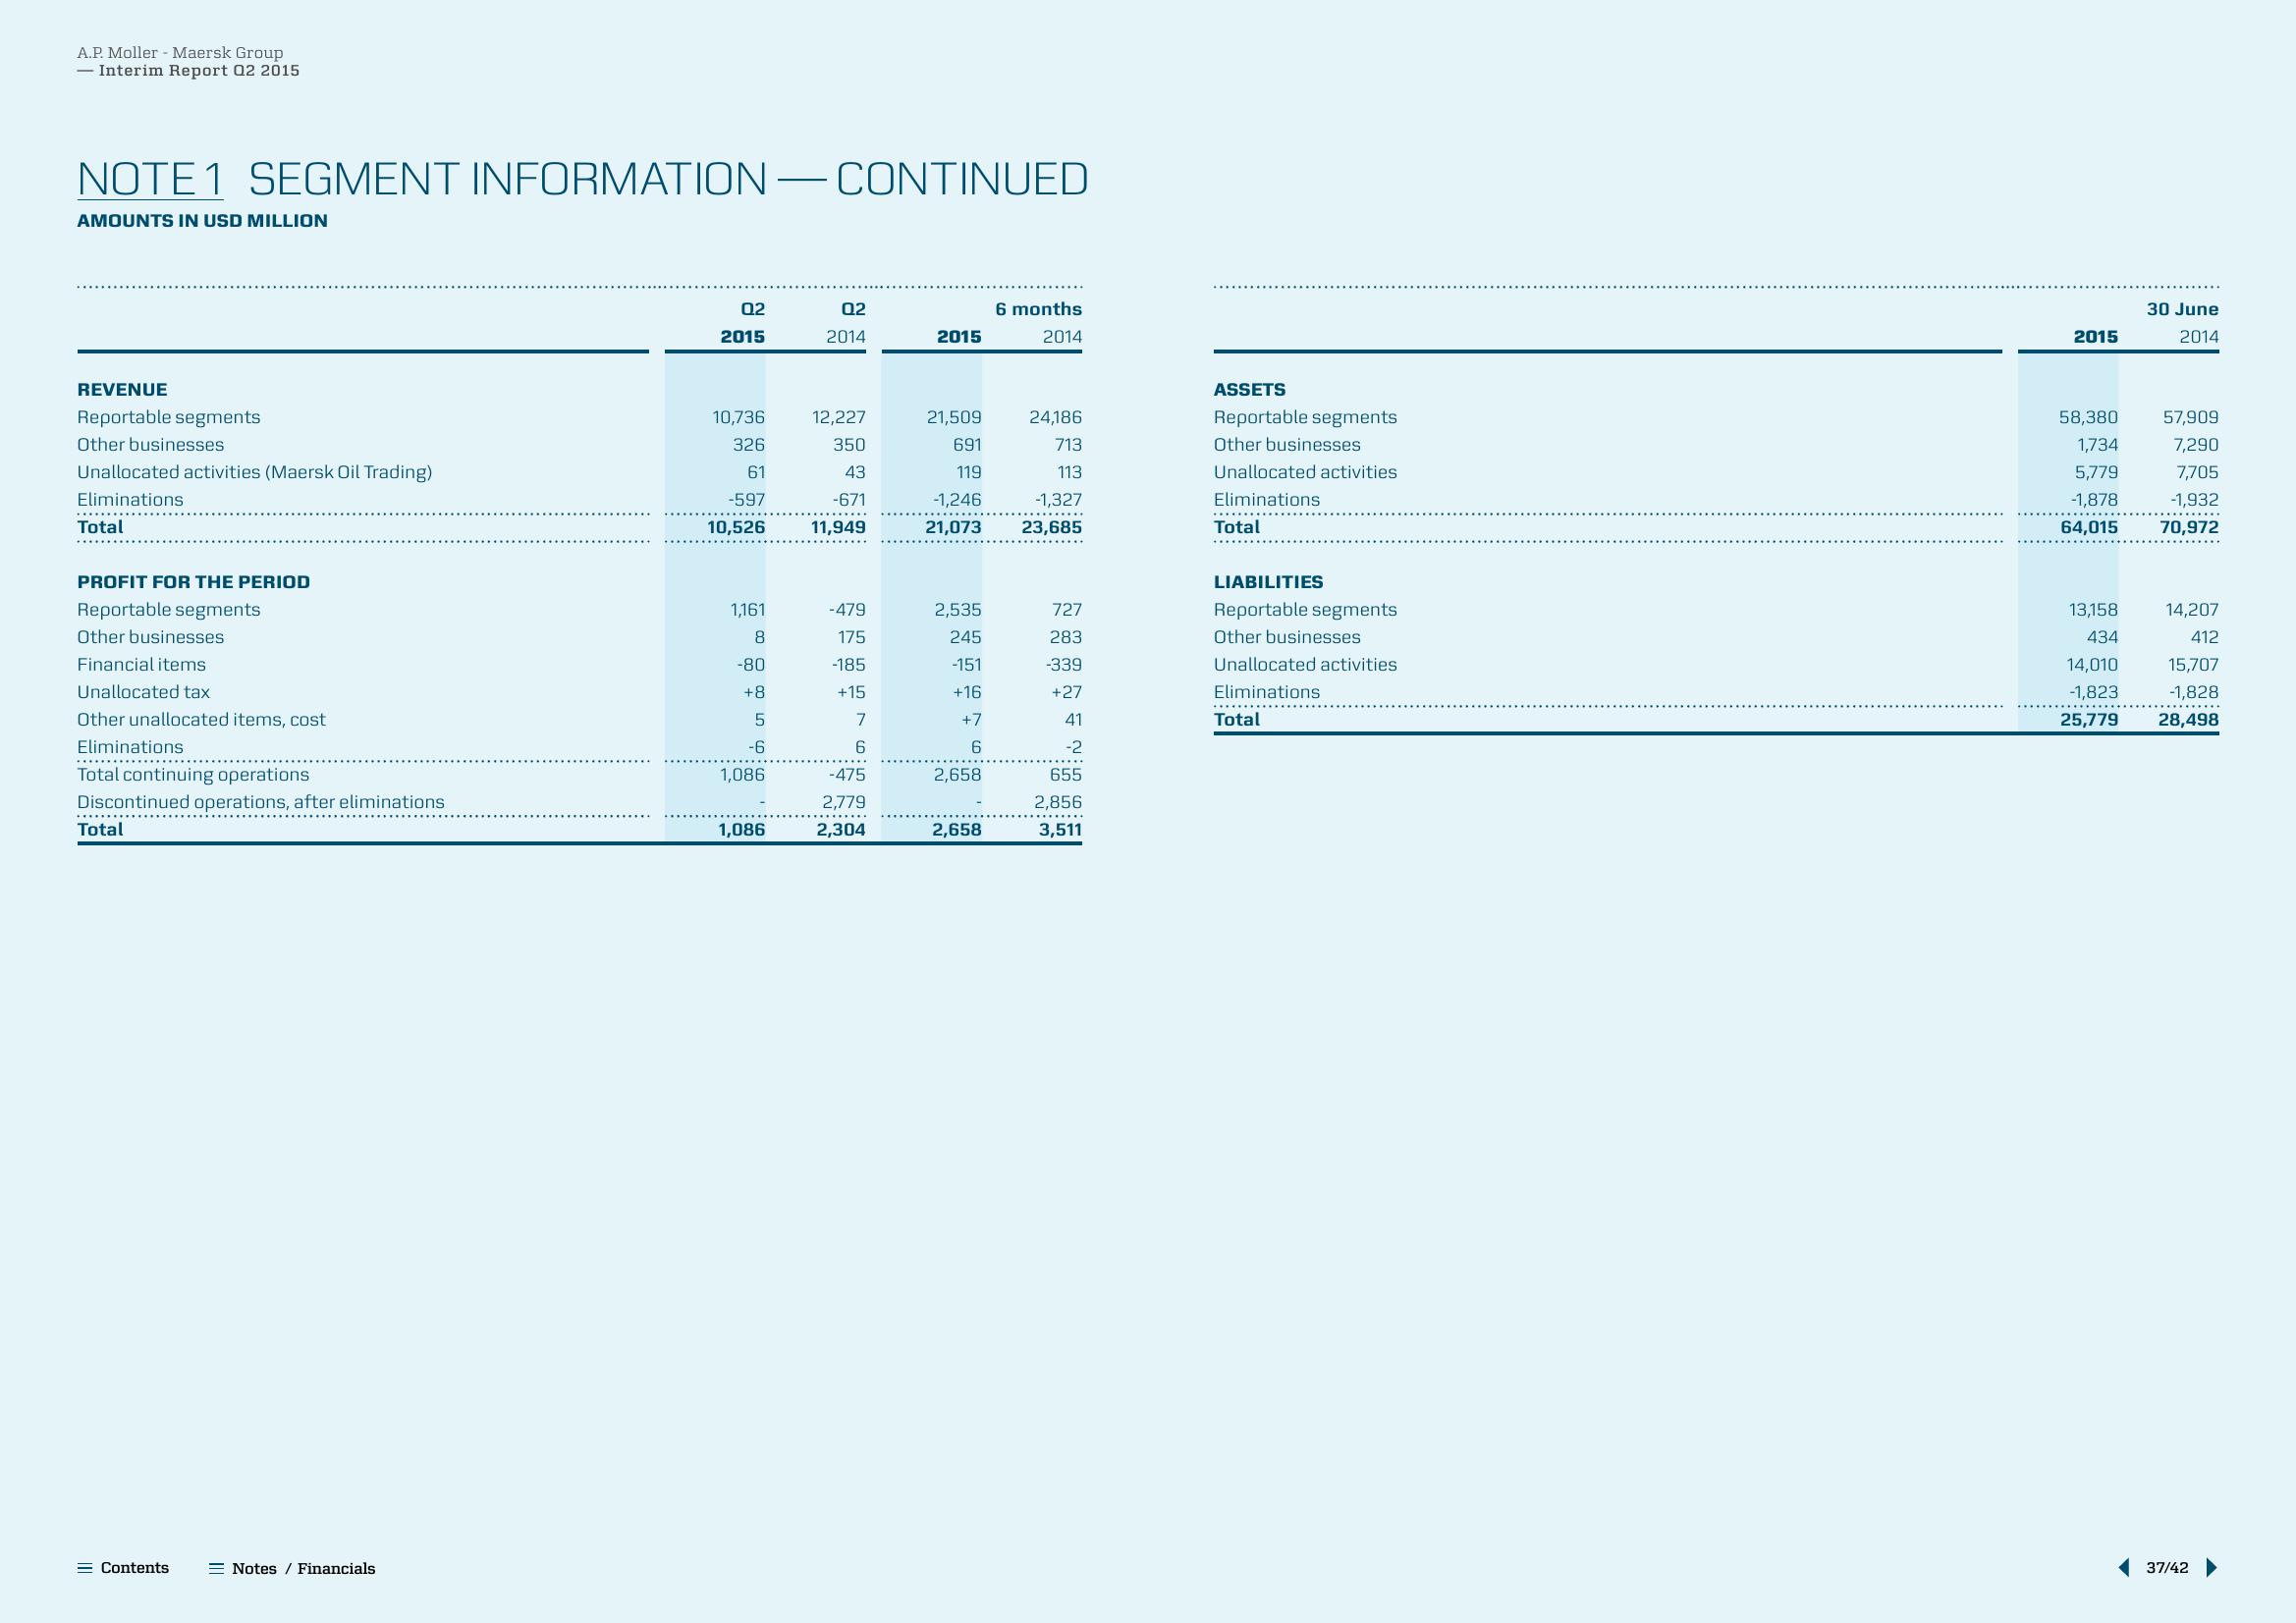
NOTE 1 SEGMENT INFORMATION CONTINUED
AMOUNTS IN USD MILLION
REVENUE
Reportable segments
Other businesses
Unallocated activities (Maersk Oil Trading)
Eliminations
Total
PROFIT FOR THE PERIOD
Reportable segments
Other businesses
Financial items
Unallocated tax
Other unallocated items, cost
Eliminations
Total continuing operations
Discontinued operations, after eliminations
Total
= Contents
Notes / Financials
02
2015
10,736
326
61
-597
10,526
1,161
8
-80
+8
5
-6
1,086
1,086
- —
02
2014
12,227
350
43
-671
11,949
-479
175
-185
+15
7
6
-475
2,779
2,304
2015
21,509
691
119
-1,246
21,073
2,535
245
-151
+16
+7
6
2,658
2,658
6 months
2014
24,186
713
113
-1,327
23,685
727
283
-339
+27
41
-2
655
2,856
3,511
ASSETS
Reportable segments
Other businesses
Unallocated activities.
Eliminations
.........
Total
LIABILITIES
Reportable segments
Other businesses
Unallocated activities
Eliminations
Total
2015
58,380
1,734
5,779
-1,878
64,015
13,158
434
14,010
-1,823
25,779
30 June
2014
57,909
7,290
7,705
-1,932
70,972
14,207
412
15,707
-1,828
28,498
37/42 ▶View entire presentation