XP Inc Results Presentation Deck
Adjusted EBITDA and Margin
Operational Leverage despite investments in technology, client experience and product offering
Operating Expenses (in R$ mn)
SG&A¹
% of Net
Revenue
765
■
2Q20
33.2%
+18%
900
2Q21
29.8%
Headcount Evolution
(2)
See appendix for a reconciliation of Adjusted EBITDA.
3
2001
19 years
2,091
3Q19
(IPO)
1.5 years
4,489
Highlights
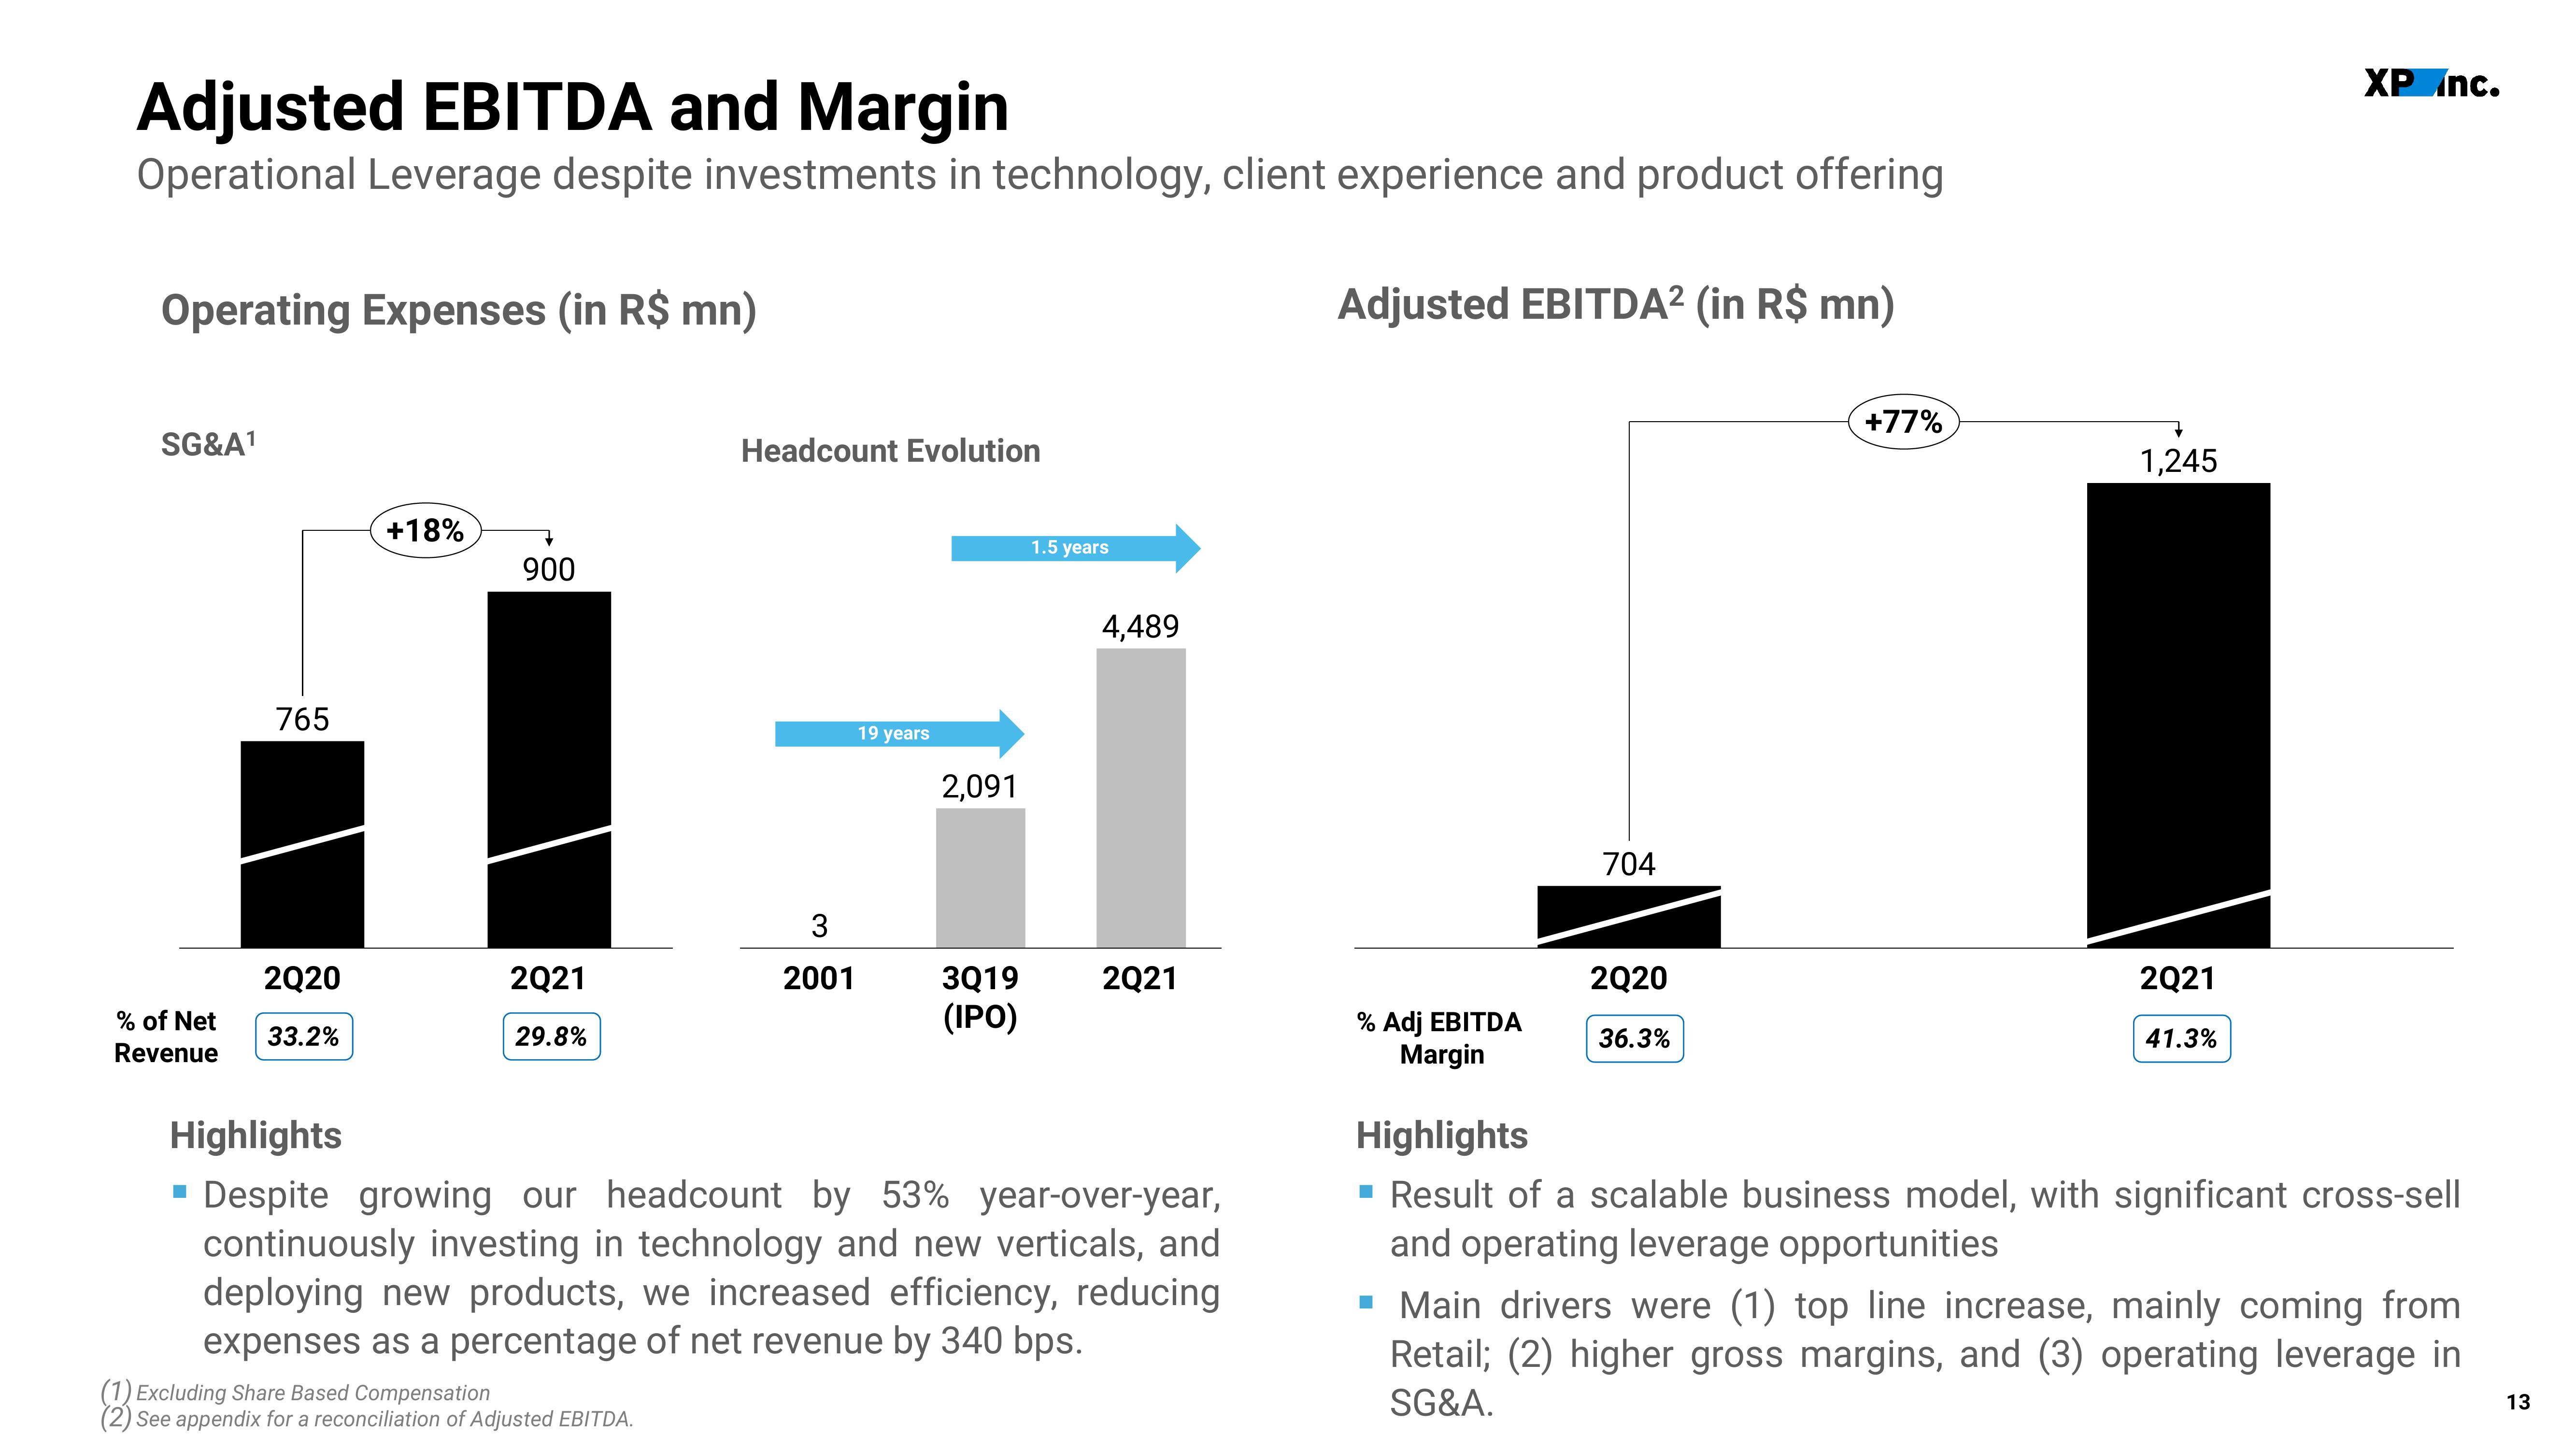
Despite growing our headcount by 53% year-over-year,
continuously investing in technology and new verticals, and
deploying new products, we increased efficiency, reducing
expenses as a percentage of net revenue by 340 bps.
2Q21
Adjusted EBITDA² (in R$ mn)
% Adj EBITDA
Margin
704
2Q20
36.3%
+77%
1,245
2Q21
41.3%
XP Inc.
Highlights
▪ Result of a scalable business model, with significant cross-sell
and operating leverage opportunities
▪ Main drivers were (1) top line increase, mainly coming from
Retail; (2) higher gross margins, and (3) operating leverage in
SG&A.
13View entire presentation