NioCorp SPAC Presentation Deck
Operating Year
Production
Niobium
Scandium
Titanium
Realized Pricing
Niobium
Scandium
Titanium
Gross Revenues ($M)
Total Opex ($M)
EBITDA ($M) 2
EBITDA Margin 2
Operating CF ($M) ²
EBT ($M)²
Net Income ($M)
Income Margin
NioCorp
Critical Mineral Security
t-Nb
kg-Sc₂03
t-TiO₂
$/kg
$/kg
$/kg
1
4,960
116
13,063
$45.46
$3,986
$0.99
$701
($205)
$496
71%
$496
$227
$227
32%
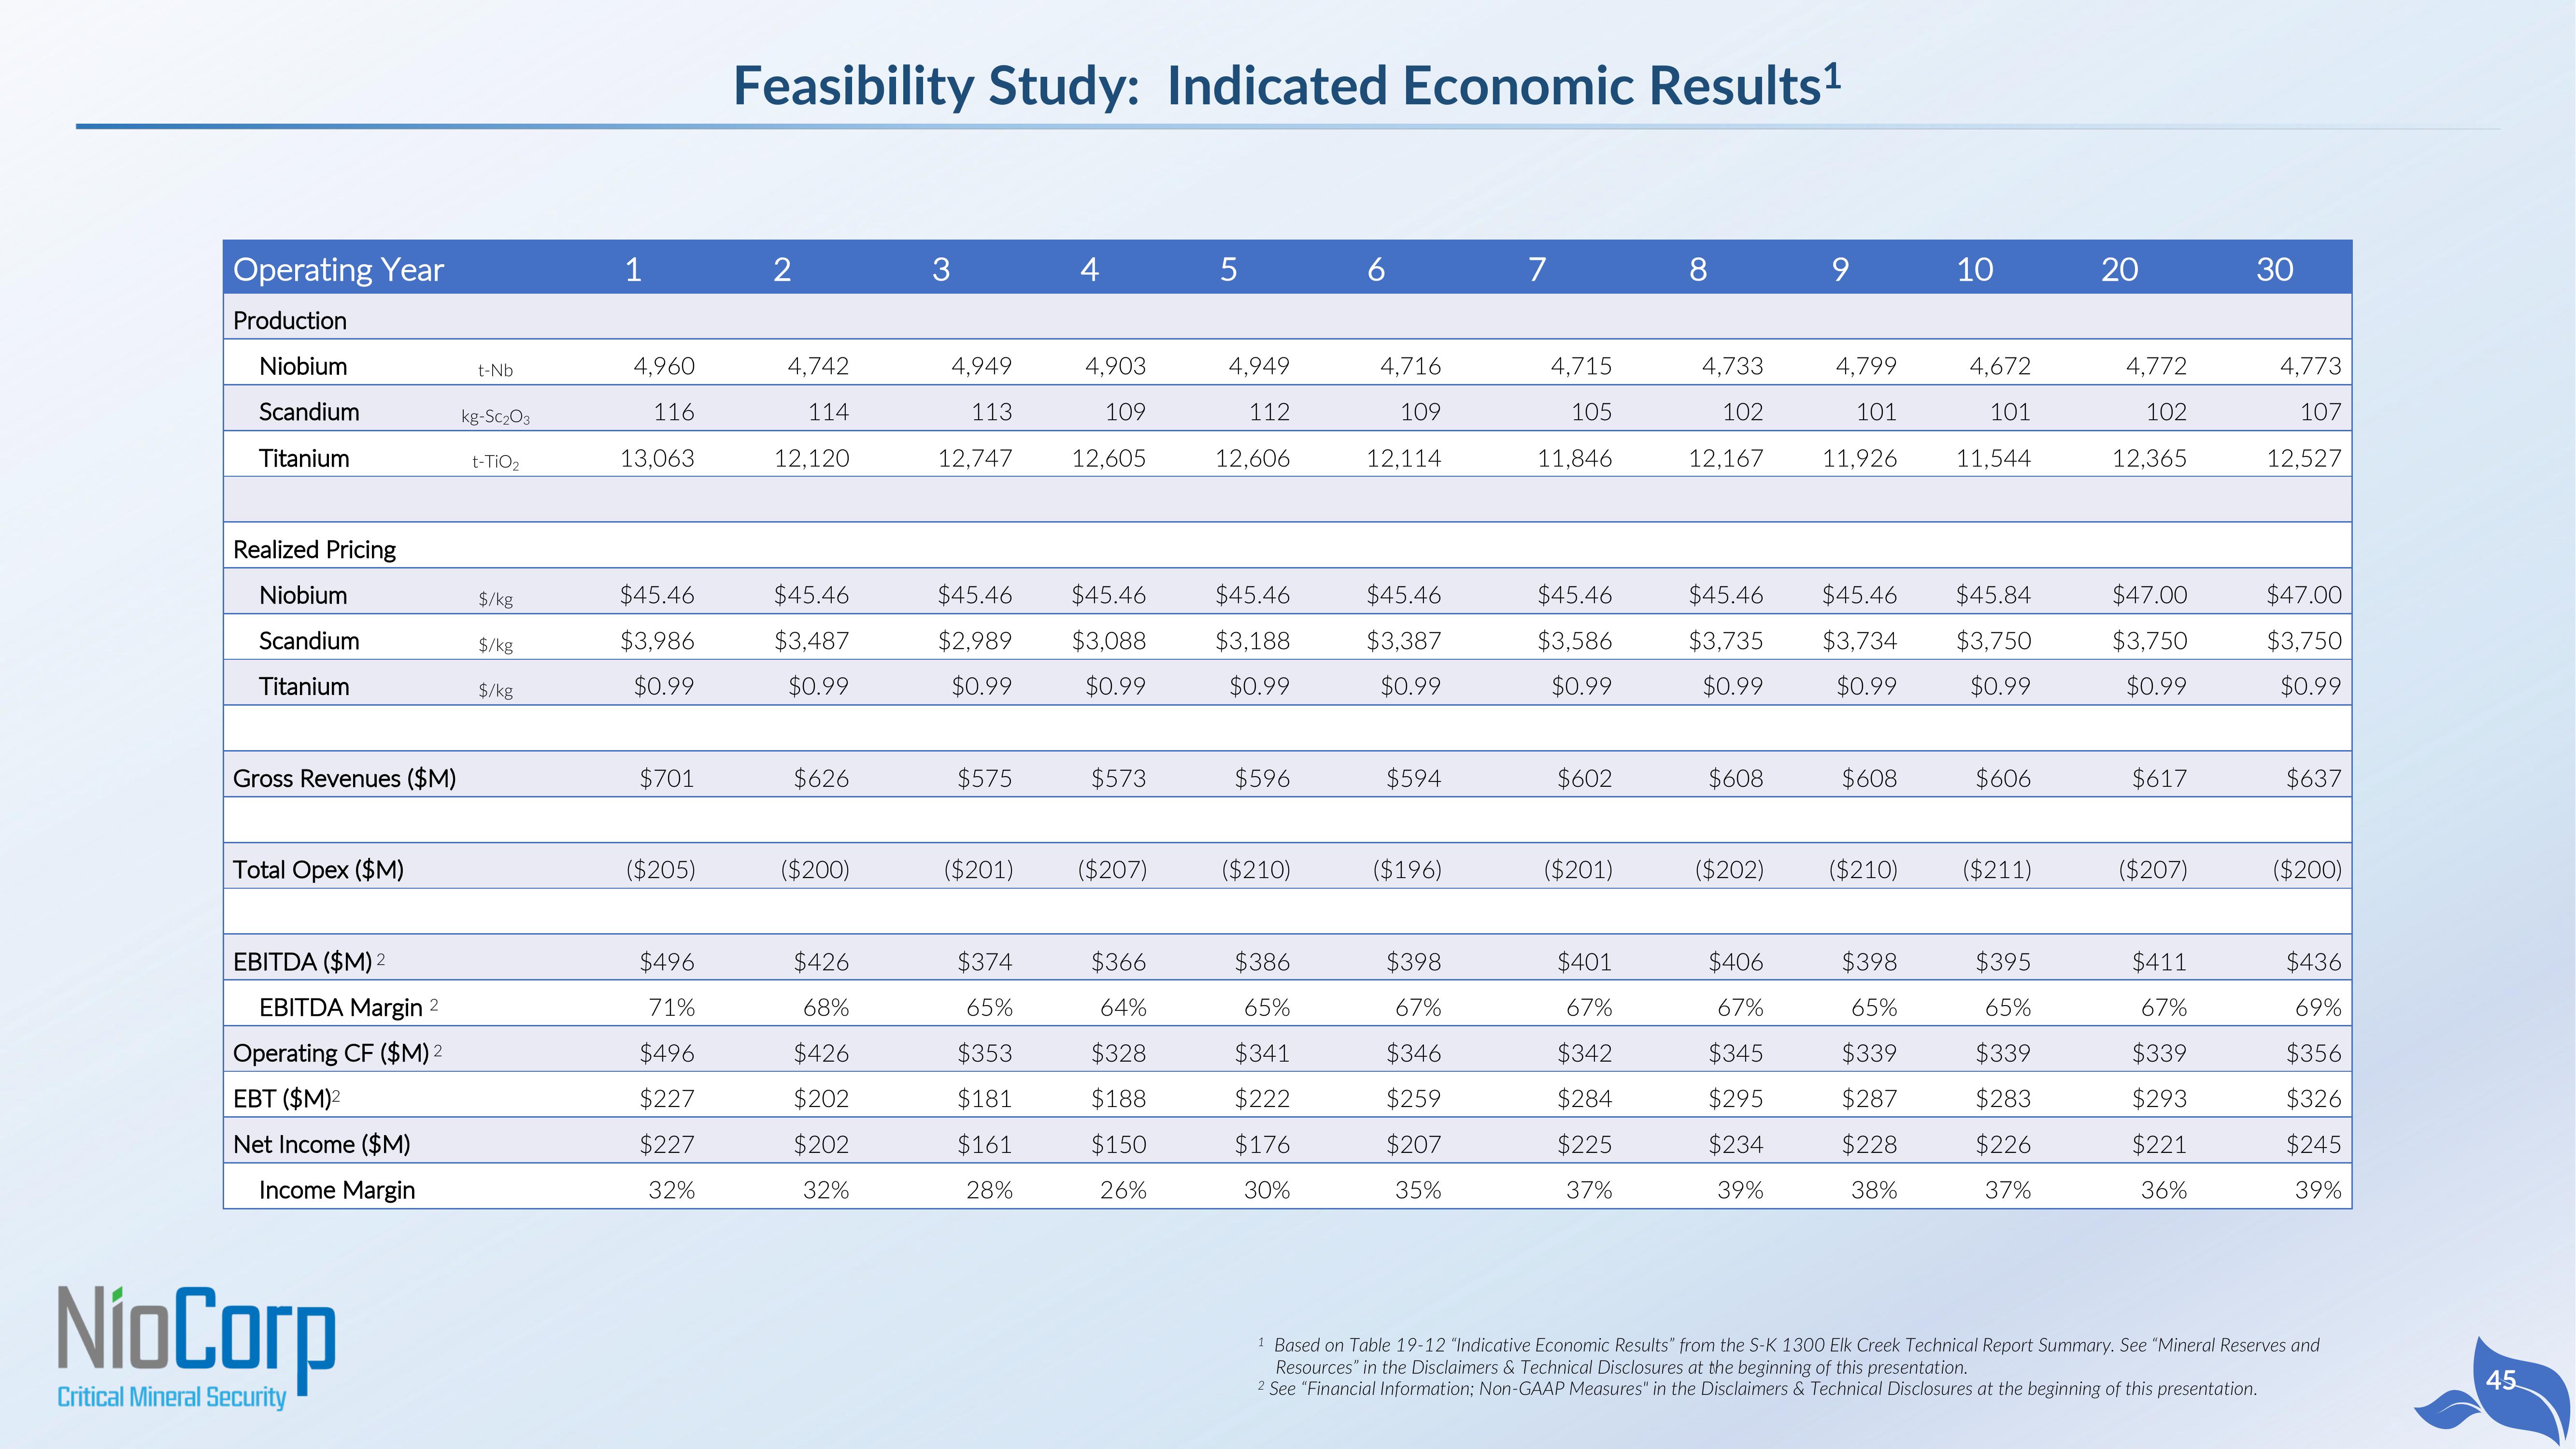
Feasibility Study: Indicated Economic Results ¹
2
4,742
114
12,120
$3,487
$0.99
$626
($200)
$426
68%
$426
$202
$202
32%
3
4,949
113
12,747
$575
4
$45
$45.46
$2,989 $3,088
$0.99
$0.99
4,903
109
12,605
$374
65%
$353
$181
$161
28%
$573
($201) ($207)
$366
64%
$328
$188
$150
26%
5
4,949
112
12,606
$45.46
$3,188
$0.99
$596
($210)
$386
65%
$341
$222
$176
30%
6
4,716
109
12,114
$3,387
$0.99
$594
($196)
$398
67%
$346
$259
$207
35%
7
4,715
105
11,846
$45
$3,586
$0.99
$602
($201)
$401
67%
$342
$284
$225
37%
8
4,733
102
12,167
$45.4
$3,735
$0.99
$608
($202)
$406
67%
$345
$295
$234
39%
9
4,799
101
11,926
$608
$45
$45.84
$3,734 $3,750
$0.99
$0.99
($210)
10
$398
65%
$339
$287
$228
38%
4,672
101
11,544
$606
($211)
$395
65%
$339
$283
$226
37%
20
4,772
102
12,365
$47.00
$3,750
$0.99
$617
($207)
$411
67%
$339
$293
$221
36%
30
4,773
107
12,527
$47.00
$3,750
$0.99
$637
($200)
$436
69%
$356
$326
$245
39%
1 Based on Table 19-12 "Indicative Economic Results from the S-K 1300 Elk Creek Technical Report Summary. See "Mineral Reserves and
Resources" in the Disclaimers & Technical Disclosures at the beginning of this presentation.
2 See "Financial Information; Non-GAAP Measures" in the Disclaimers & Technical Disclosures at the beginning of this presentation.
45View entire presentation