Nexters Results Presentation Deck
Key financial highlights (2/2)
$m
Selling and Marketing Expenses
6
21
Q3 2022
112
9M 2022
Source:
>100%
+53%
43
Company information
Q3 2023
172
9M 2023
$m
G&A Expenses
13
Q3 2022
28
9M 2022
-45%
-21%
7
Q3 2023
22
9M 2023
$m
Total Costs and Expenses, excl. D&A
82
Q3 2022
281
9M 2022
+10%
+14%
91
Q3 2023
320
9M 2023
GDEU
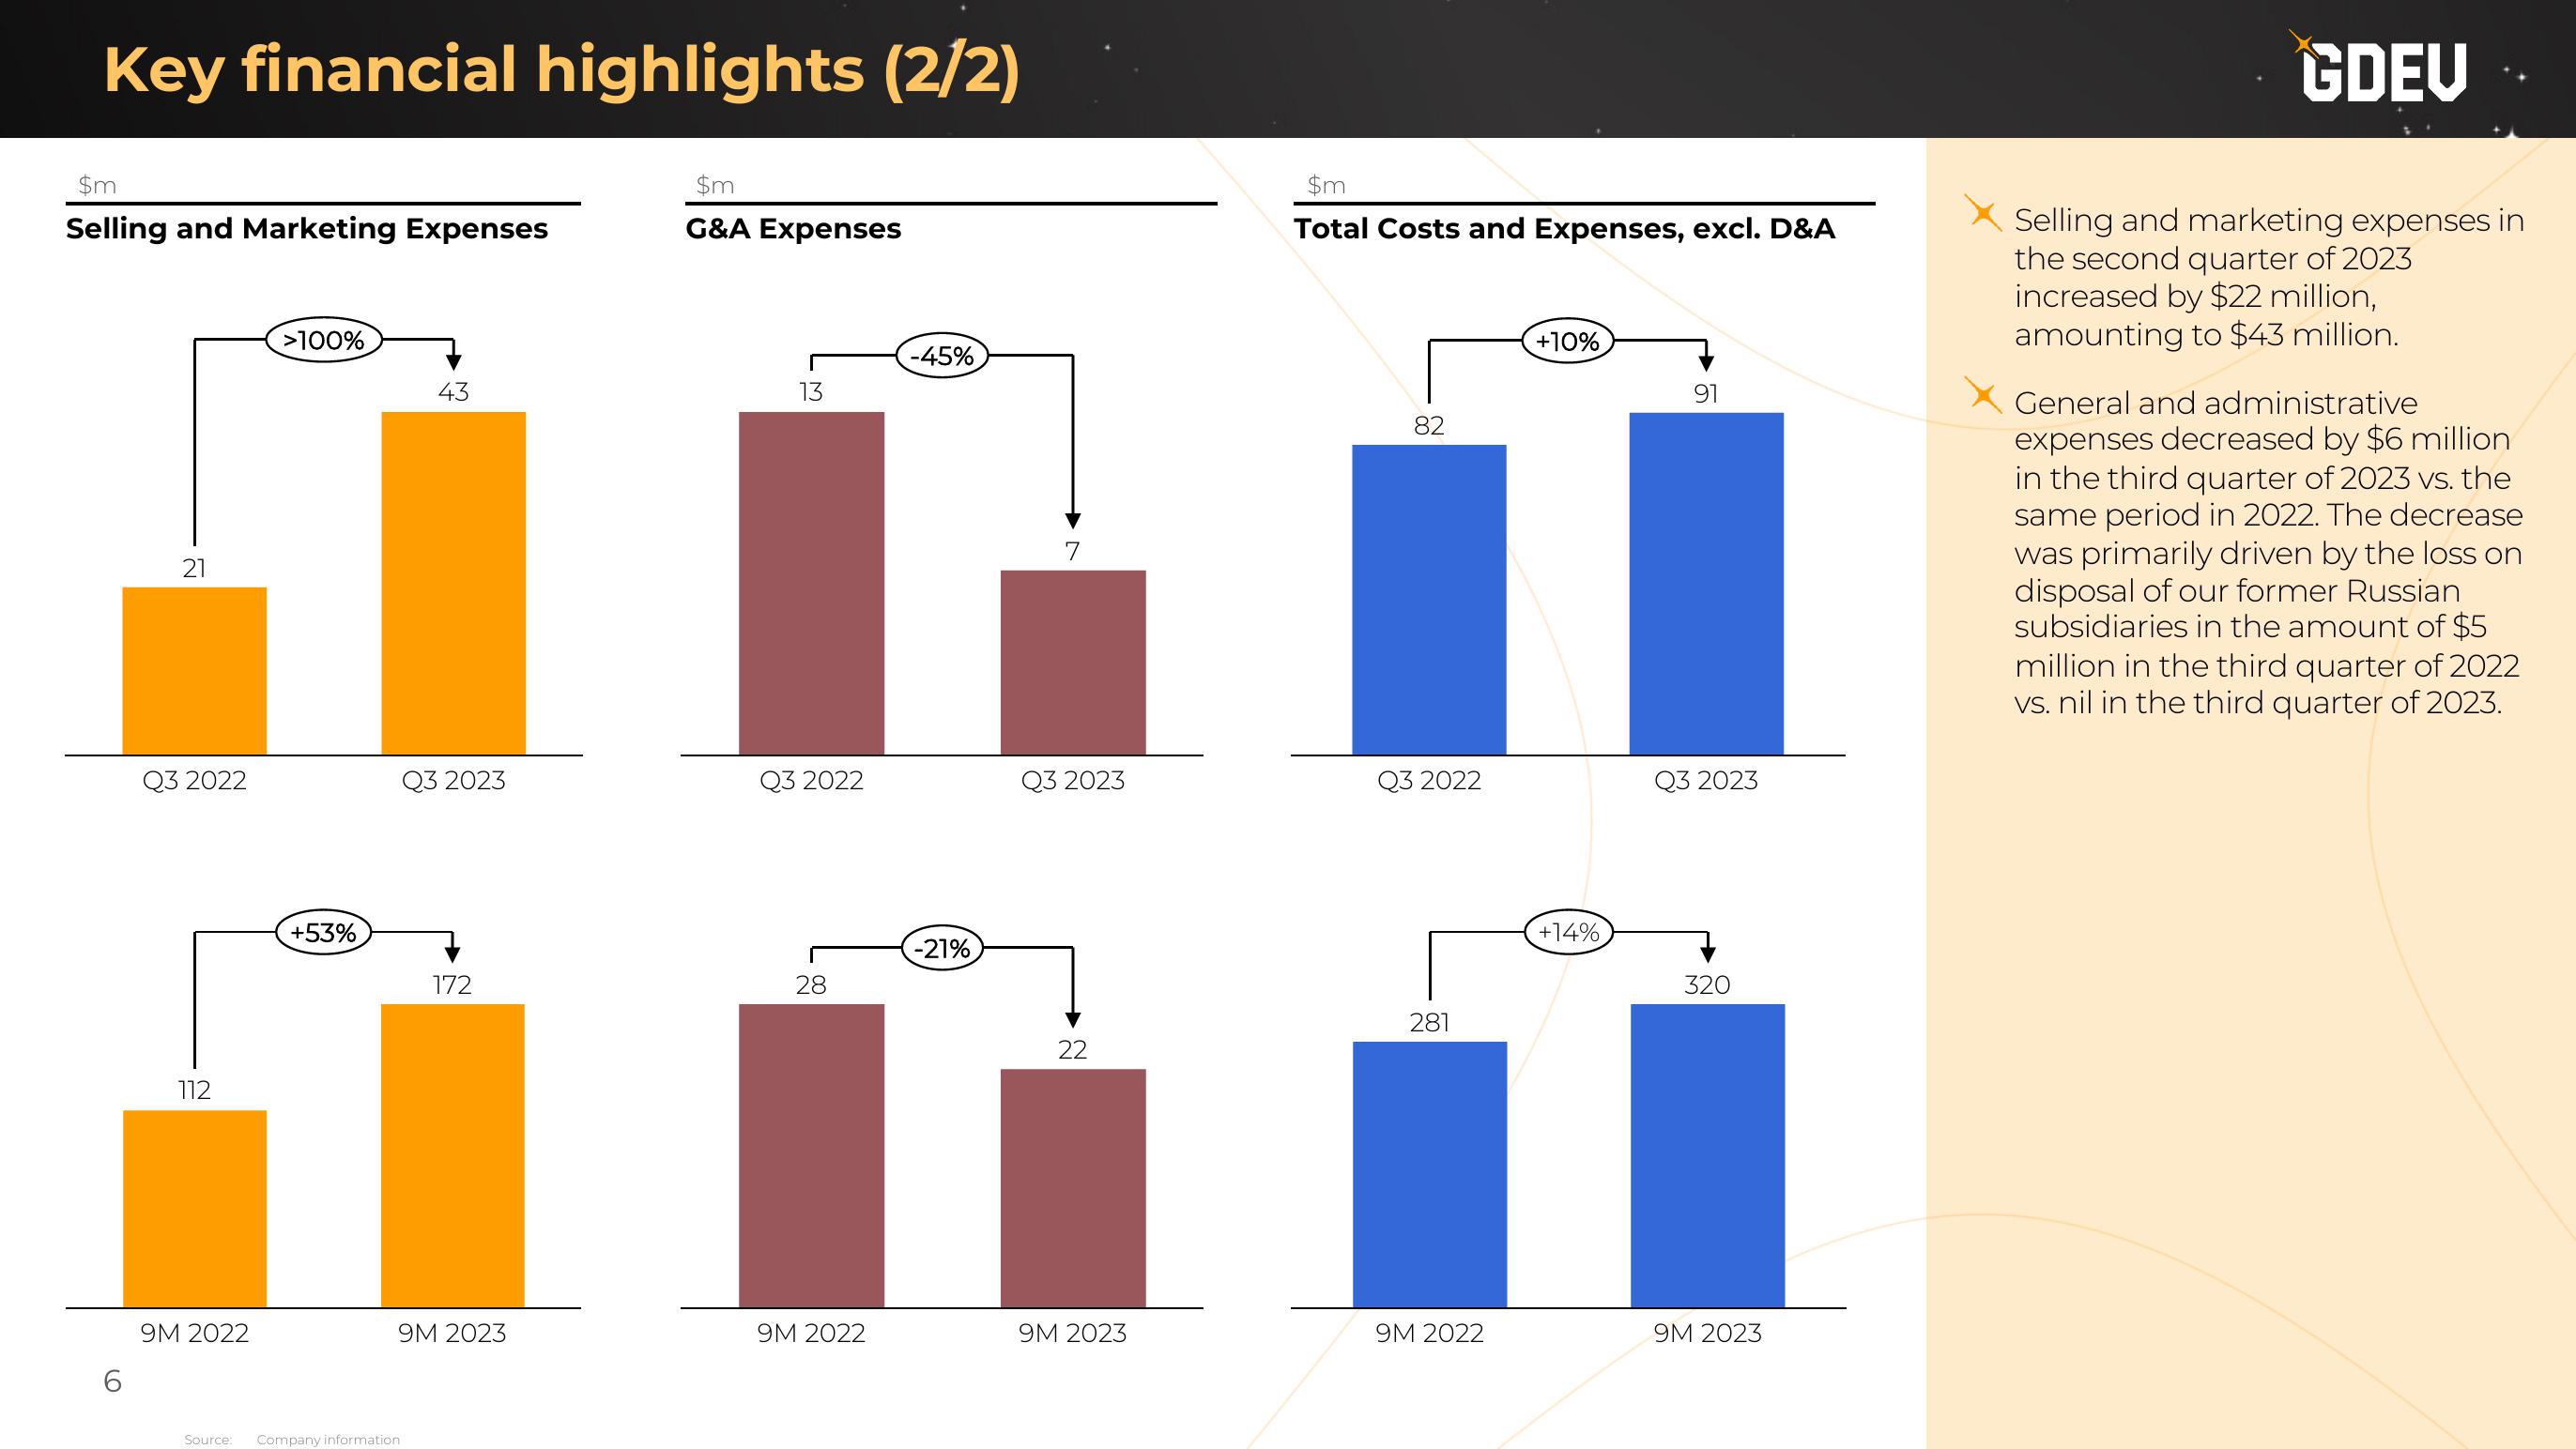
Selling and marketing expenses in
the second quarter of 2023
increased by $22 million,
amounting to $43 million.
General and administrative
expenses decreased by $6 million
in the third quarter of 2023 vs. the
same period in 2022. The decrease
was primarily driven by the loss on
disposal of our former Russian
subsidiaries in the amount of $5
million in the third quarter of 2022
vs. nil in the third quarter of 2023.View entire presentation