Kore Results Presentation Deck
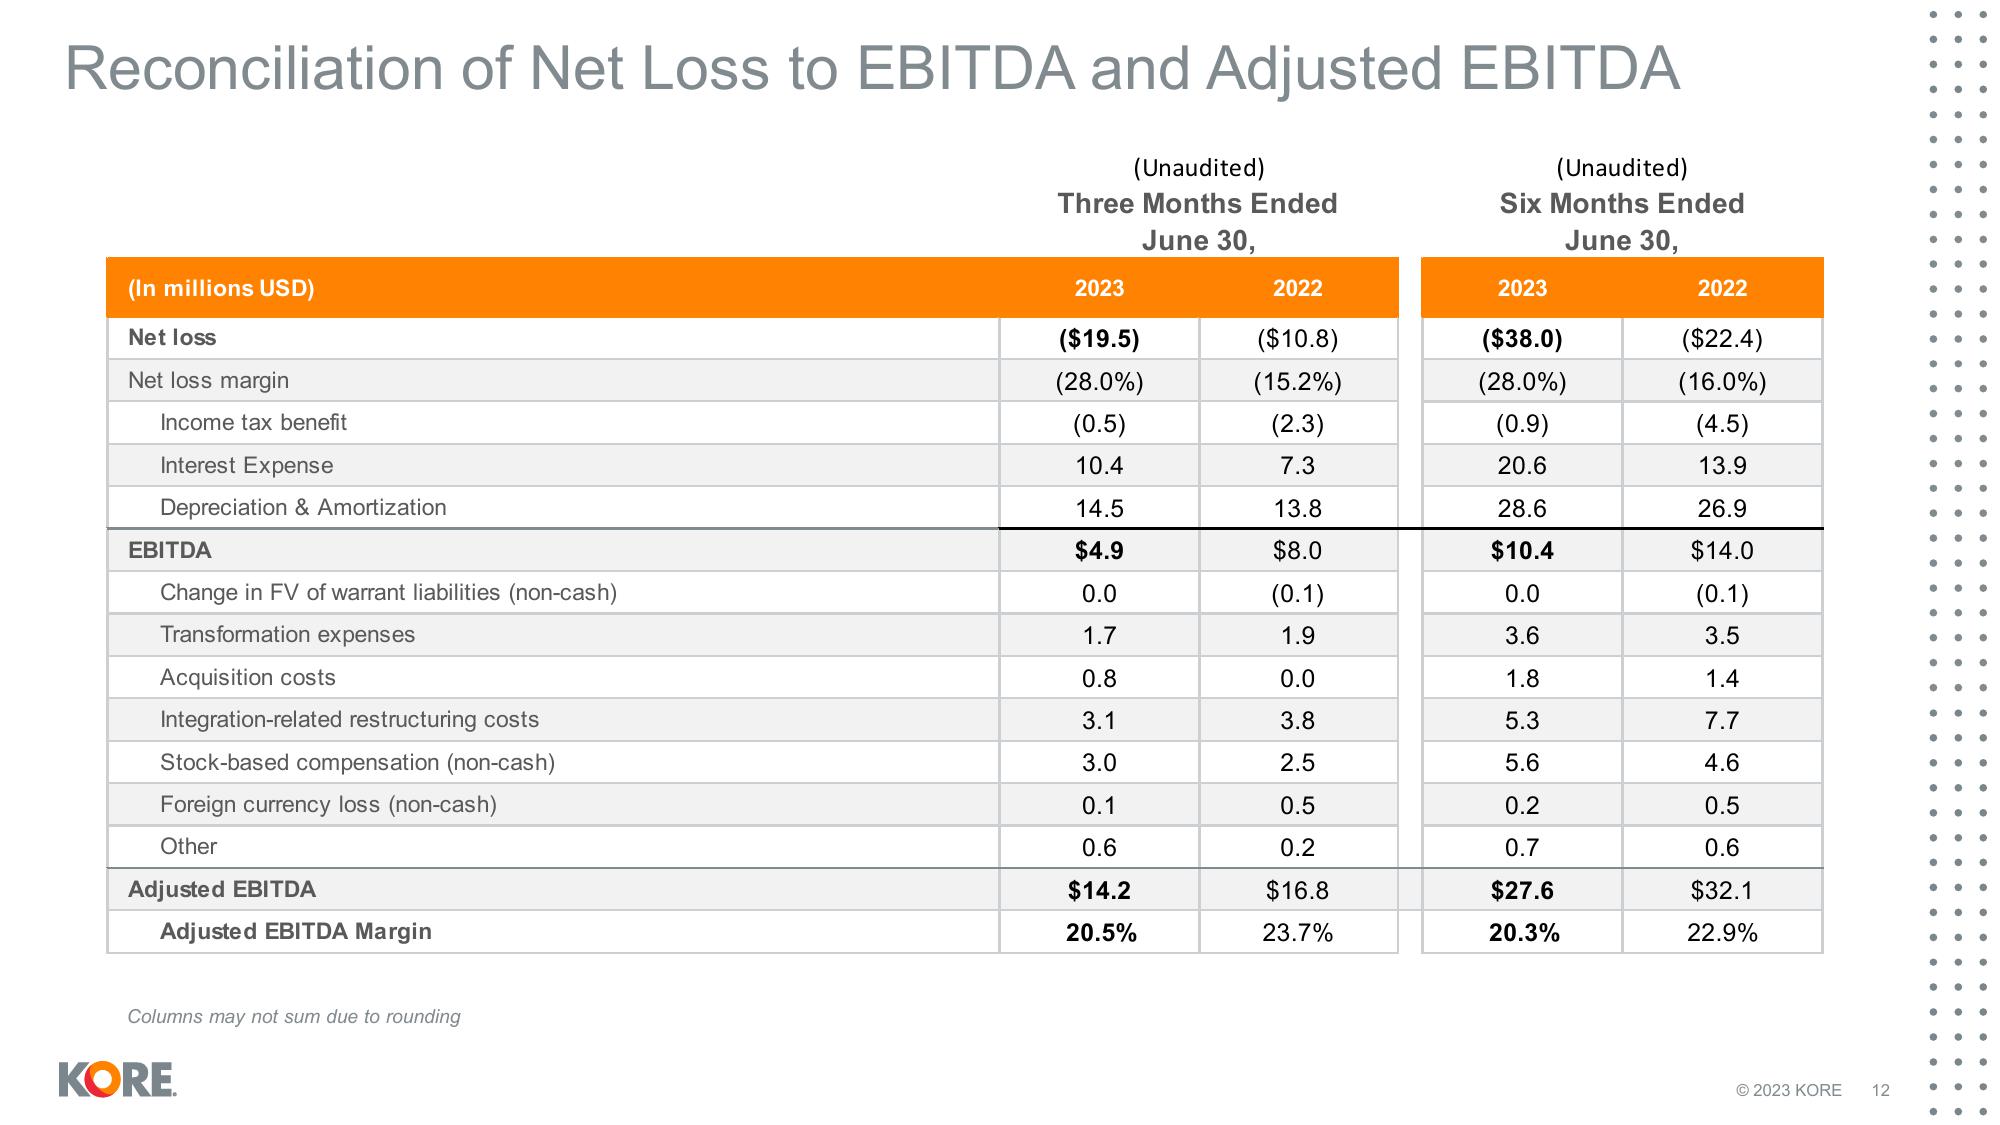
Reconciliation of Net Loss to EBITDA and Adjusted EBITDA
(Unaudited)
Six Months Ended
June 30,
(In millions USD)
Net loss
Net loss margin
Income tax benefit
Interest Expense
Depreciation & Amortization
EBITDA
Change in FV of warrant liabilities (non-cash)
Transformation expenses
Acquisition costs
Integration-related restructuring costs
Stock-based compensation (non-cash)
Foreign currency loss (non-cash)
Other
Adjusted EBITDA
Adjusted EBITDA Margin
Columns may not sum due to rounding
KORE
(Unaudited)
Three Months Ended
June 30,
2023
($19.5)
(28.0%)
(0.5)
10.4
14.5
$4.9
0.0
1.7
0.8
3.1
3.0
0.1
0.6
$14.2
20.5%
2022
($10.8)
(15.2%)
(2.3)
7.3
13.8
$8.0
(0.1)
1.9
0.0
3.8
2.5
0.5
0.2
$16.8
23.7%
2023
($38.0)
(28.0%)
(0.9)
20.6
28.6
$10.4
0.0
3.6
1.8
5.3
5.6
0.2
0.7
$27.6
20.3%
2022
($22.4)
(16.0%)
(4.5)
13.9
26.9
$14.0
(0.1)
3.5
1.4
7.7
4.6
0.5
0.6
$32.1
22.9%
© 2023 KORE 12
●
●
•
●
●
●●
●
●
●
.. ●
●
e
0
● ● •
●
●
●
●
●
•
●
0
●
●
●
● ●View entire presentation