Snap Inc Investor Presentation Deck
Snap Inc.
Average Daily Active Users¹
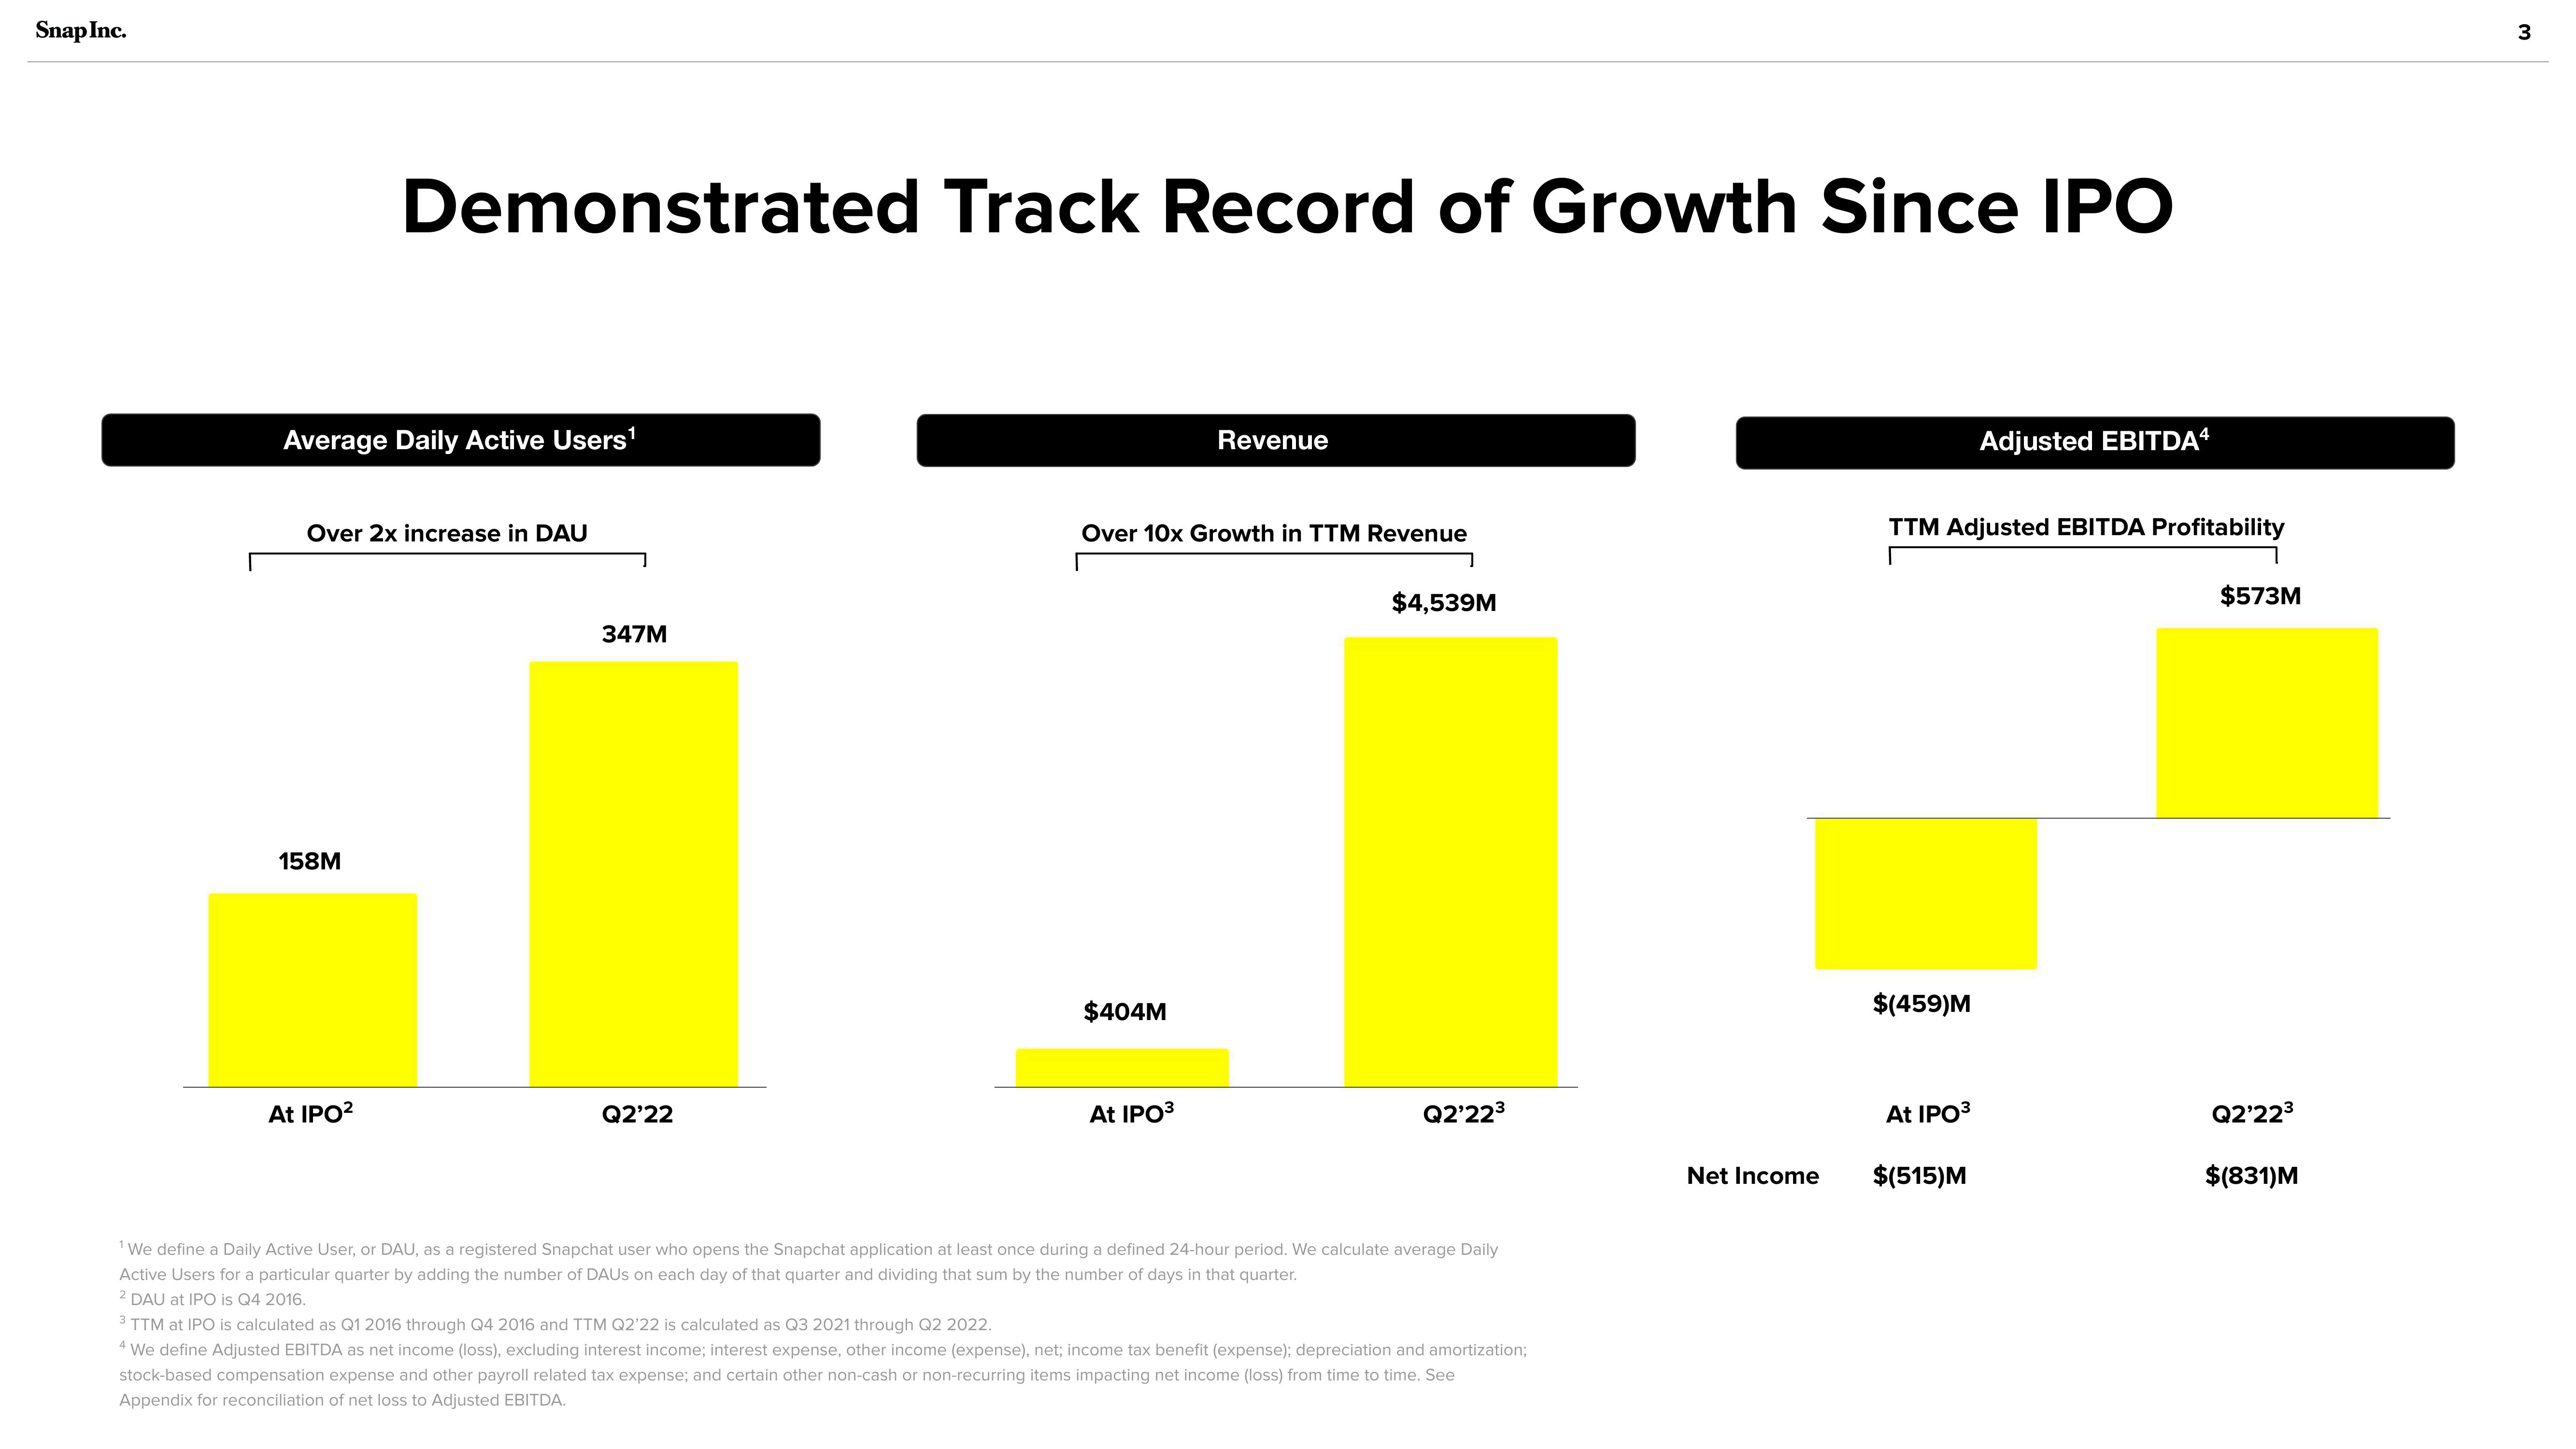
Demonstrated Track Record of Growth Since IPO
Over 2x increase in DAU
158M
At IPO²
347M
Q2'22
Over 10x Growth in TTM Revenue
$404M
Revenue
At IPO³
$4,539M
Q2'22³
¹ We define a Daily Active User, or DAU, as a registered Snapchat user who opens the Snapchat application at least once during a defined 24-hour period. We calculate average Daily
Active Users for a particular quarter by adding the number of DAUS on each day of that quarter and dividing that sum by the number of days in that quarter.
2 DAU at IPO is Q4 2016.
3 TTM at IPO is calculated as Q1 2016 through Q4 2016 and TTM Q2'22 is calculated as Q3 2021 through Q2 2022.
4 We define Adjusted EBITDA as net income (loss), excluding interest income; interest expense, other income (expense), net; income tax benefit (expense); depreciation and amortization;
stock-based compensation expense and other payroll related tax expense; and certain other non-cash or non-recurring items impacting net income (loss) from time to time. See
Appendix for reconciliation of net loss to Adjusted EBITDA.
Net Income
TTM Adjusted EBITDA Profitability
$(459)M
At IPO³
Adjusted EBITDA4
$(515)M
$573M
Q2'22³
$(831)M
3View entire presentation