Dutch Bros Results Presentation Deck
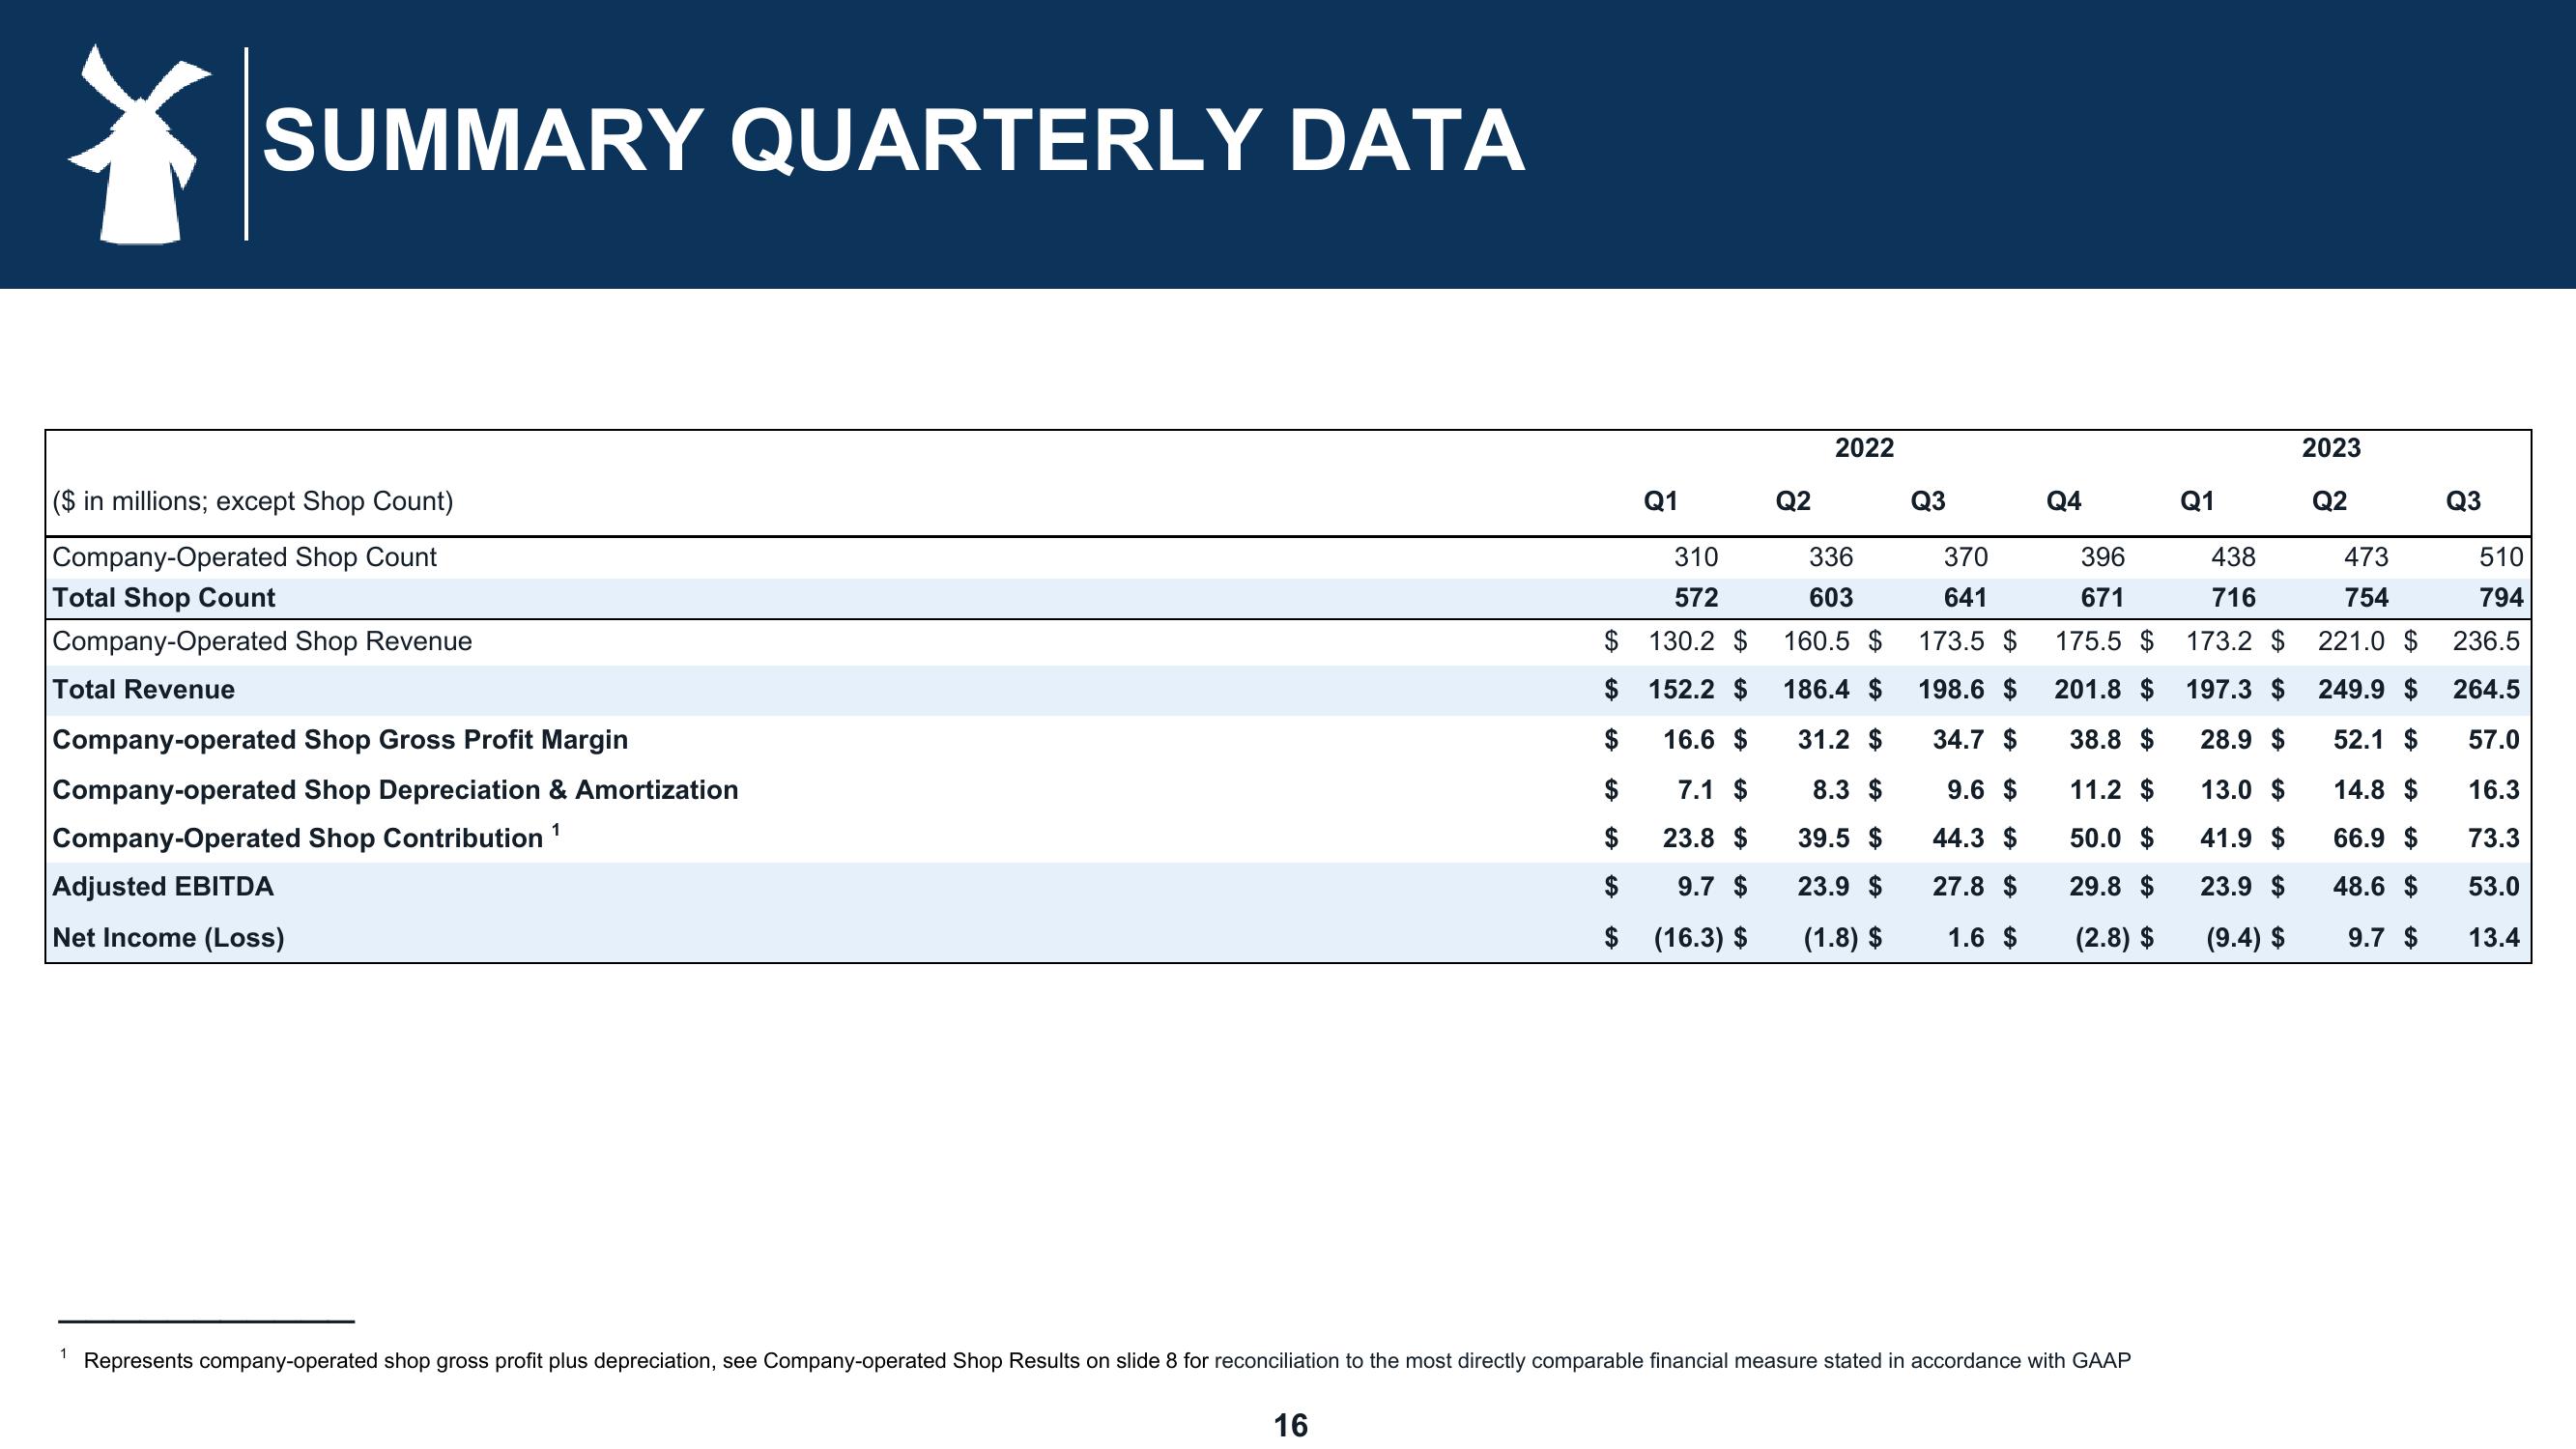
SUMMARY QUARTERLY DATA
($ in millions; except Shop Count)
Company-Operated Shop Count
Total Shop Count
Company-Operated Shop Revenue
Total Revenue
Company-operated Shop Gross Profit Margin
Company-operated Shop Depreciation & Amortization
Company-Operated Shop Contribution
1
Adjusted EBITDA
Net Income (Loss)
16
310
572
130.2 $
$152.2 $
16.6 $
7.1 $
23.8 $
9.7 $
(16.3) $
$
$
Q1
$
$
Q2
2022
336
603
160.5 $
186.4 $
31.2 $
8.3 $
39.5 $
23.9 $
(1.8) $
Q3
370
641
173.5 $
198.6 $
34.7 $
9.6 $
44.3 $
27.8 $
1.6 $
Q4
396
671
175.5 $
201.8 $
38.8 $
11.2 $
50.0 $
29.8 $
(2.8) $
1 Represents company-operated shop gross profit plus depreciation, see Company-operated Shop Results on slide 8 for reconciliation to the most directly comparable financial measure stated in accordance with GAAP
Q1
438
716
173.2 $
197.3 $
28.9 $
13.0 $
41.9 $
23.9 $
(9.4) $
2023
Q2
473
754
221.0 $
249.9 $
52.1 $
14.8 $
66.9 $
48.6 $
9.7 $
Q3
510
794
236.5
264.5
57.0
16.3
73.3
53.0
13.4View entire presentation