Maersk Results Presentation Deck
A.P. Moller Maersk Group
- Interim Report 02 2015
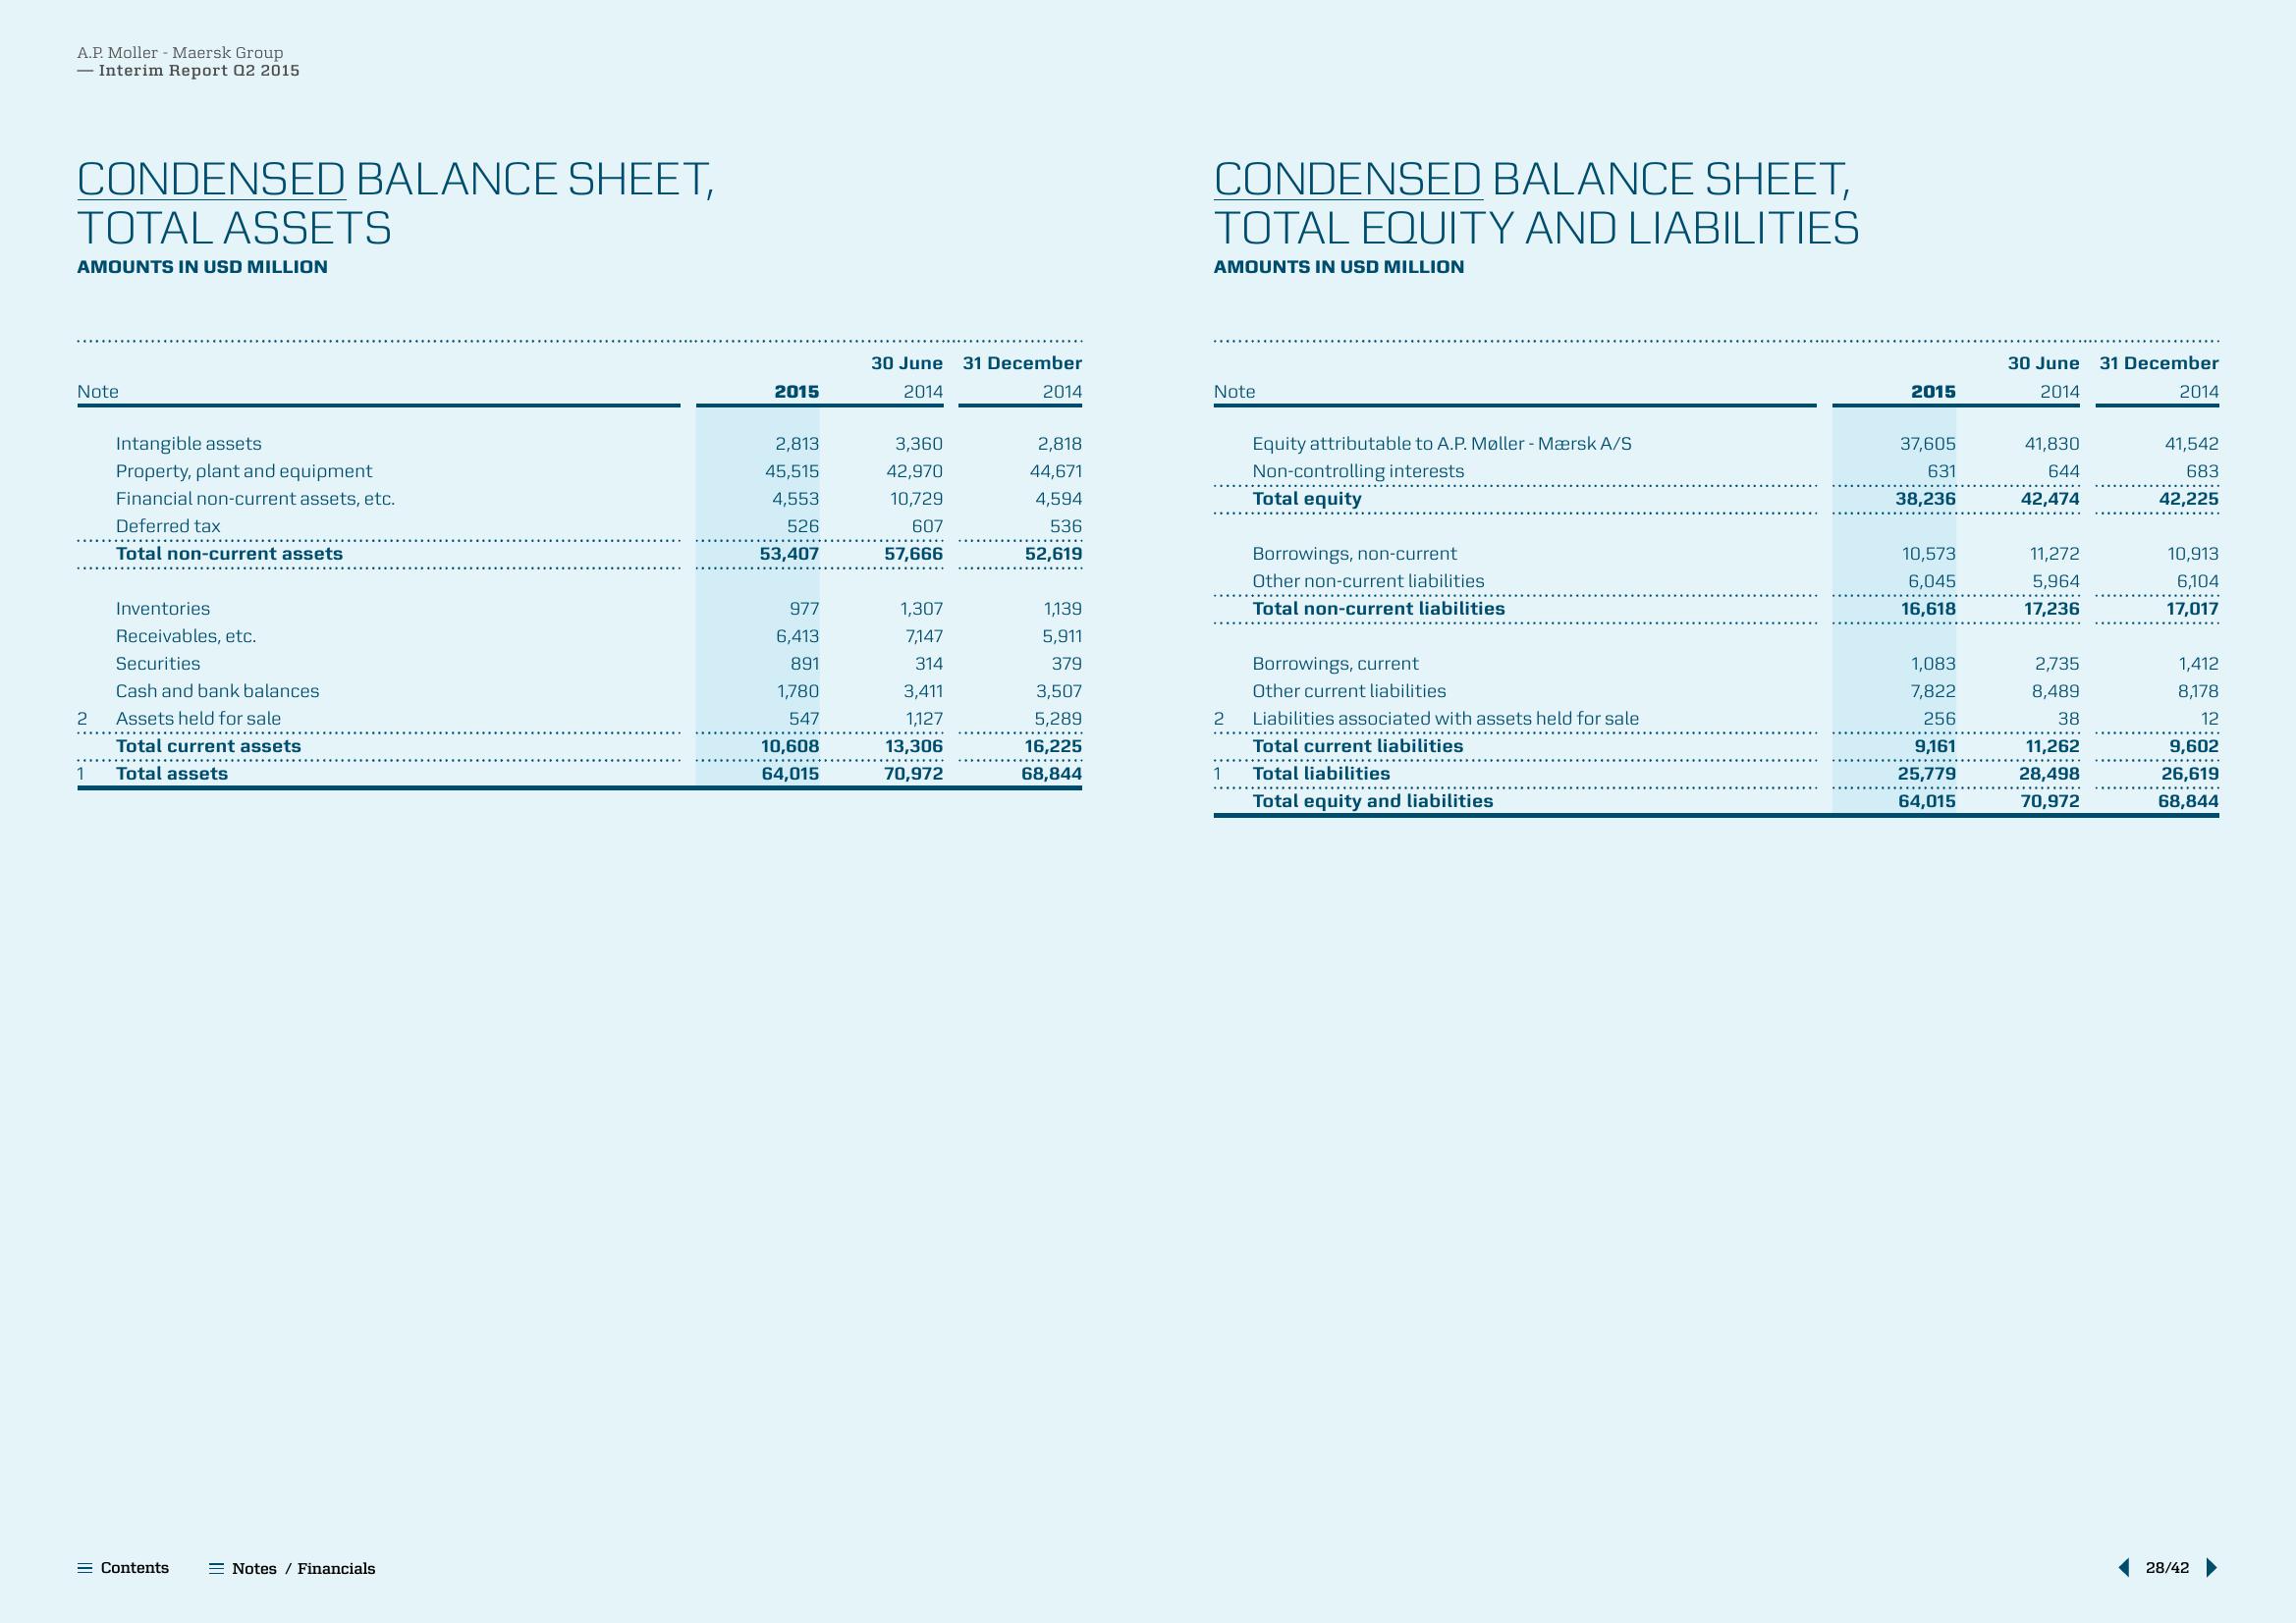
CONDENSED BALANCE SHEET,
TOTAL ASSETS
AMOUNTS IN USD MILLION
Note
2
1
Intangible assets
Property, plant and equipment
Financial non-current assets, etc.
Deferred tax
Total non-current assets
Inventories
Receivables, etc.
Securities
Cash and bank balances
Assets held for sale
Total current assets
Total assets
**********
= Contents
Notes / Financials
2015
2,813
45,515
4,553
526
53,407
977
6,413
891
1,780
547
10,608
64,015
30 June 31 December
2014
3,360
42,970
10,729
607
57,666
1,307
7,147
314
3,411
1,127
13,306
70,972
2014
2,818
44,671
4,594
536
52,619
1,139
5,911
379
3,507
5,289
16,225
68,844
CONDENSED BALANCE SHEET,
TOTAL EQUITY AND LIABILITIES
AMOUNTS IN USD MILLION
Note
Equity attributable to A.P. Møller-Mærsk A/S
Non-controlling interests
Total equity
Borrowings, non-current
Other non-current liabilities
Total non-current liabilities
Borrowings, current
Other current liabilities
2 Liabilities associated with assets held for sale
***********
Total current liabilities
1 Total liabilities
Total equity and liabilities
2015
37,605
631
38,236
10,573
6,045
16,618
1,083
7,822
256
9,161
25,779
64,015
30 June 31 December
2014
2014
41,830
644
42,474
11,272
5,964
17,236
2,735
8,489
38
11,262
28,498
70,972
41,542
683
42,225
10,913
6,104
17,017
1,412
8,178
12
9,602
26,619
68,844
28/42View entire presentation