Nogin SPAC Presentation Deck
nogin
EXECUTIVE PRESENTATION
FEBRUARY 2022
DO
nogin
Dashboard
Forecast
Audit
ABA+
Labratory
Campaigns
Settings
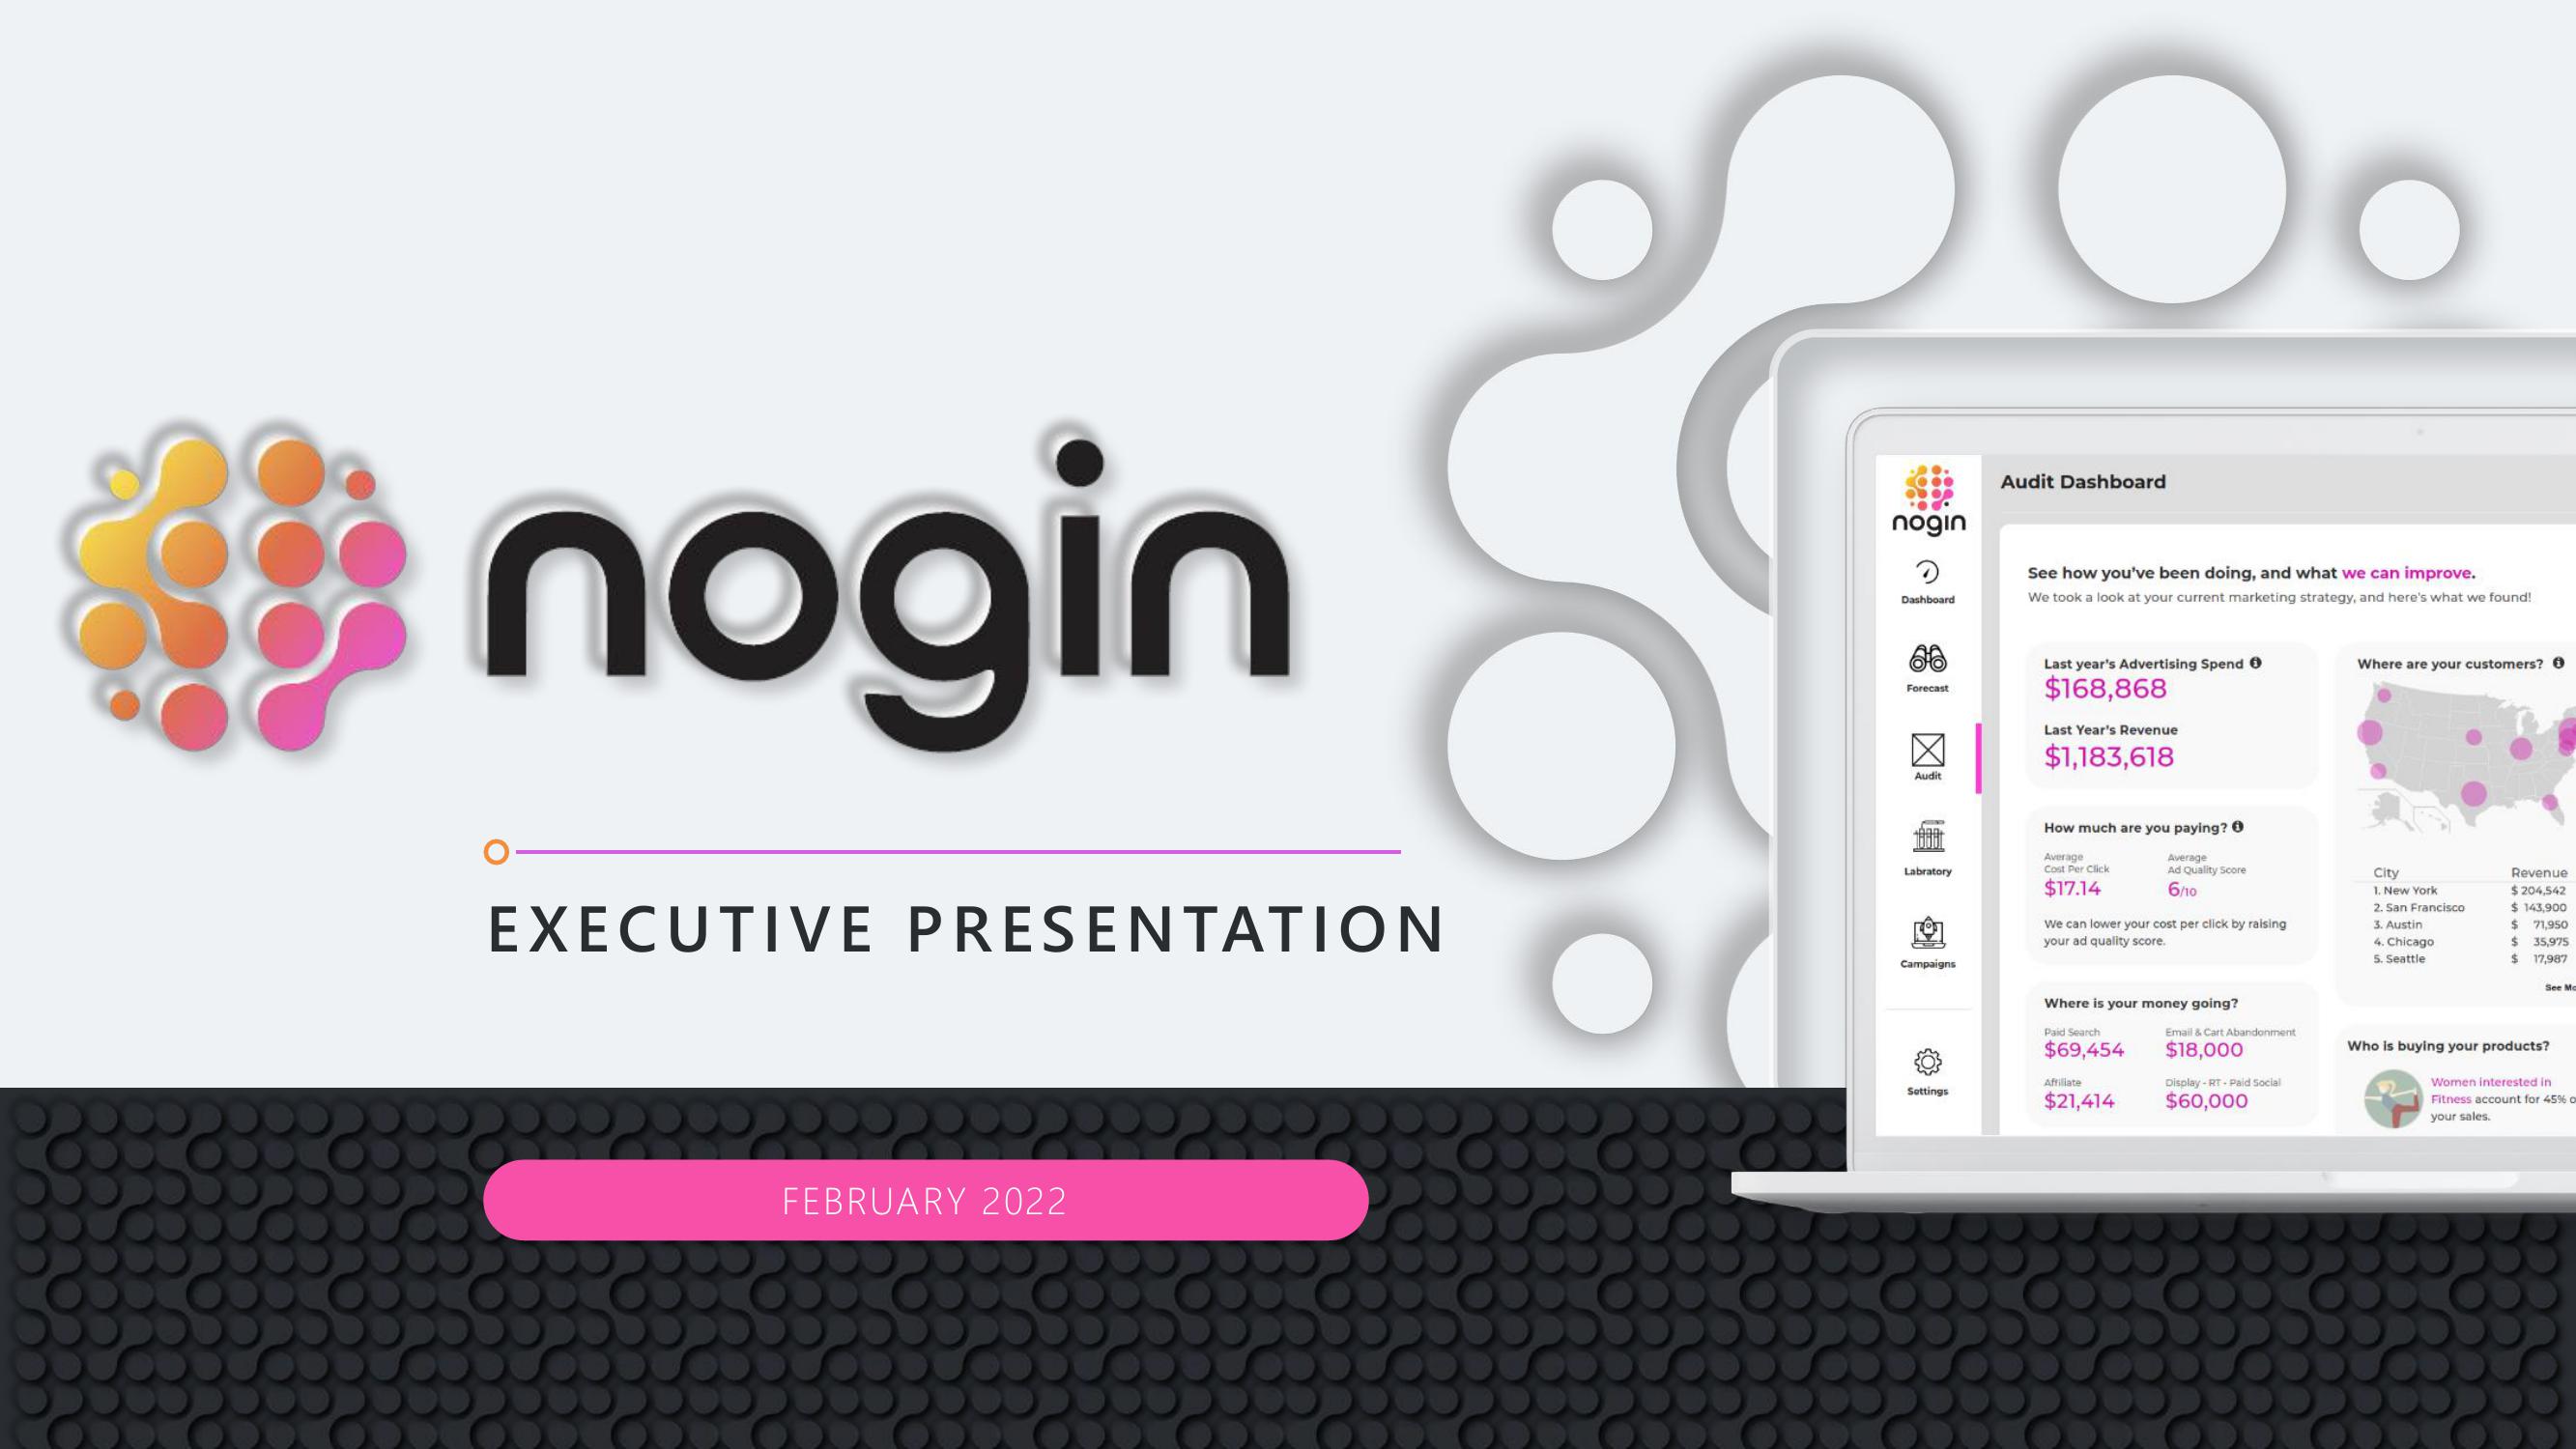
Audit Dashboard
See how you've been doing, and what we can improve.
We took a look at your current marketing strategy, and here's what we found!
Last year's Advertising Spend Ⓒ
$168,868
Last Year's Revenue
$1,183,618
How much are you paying? Ⓒ
Average
Cost Per Click
$17.14
We can lower your cost per click by raising
your ad quality score.
Average
Ad Quality Score
6/10
Where is your money going?
Paid Search
$69,454
Affiliate
$21,414
Email & Cart Abandonment
$18,000
Display-RT-Paid Social
$60,000
Where are your customers? 0
City
1. New York
2. San Francisco
3. Austin
4. Chicago
5. Seattle
Revenue
$204,542
$143,900
$ 71,950
$ 35,975
$
17,987
See Mc
Who is buying your products?
Women interested in
Fitness account for 45% o
your sales.View entire presentation