JD Sports Results Presentation Deck
JD
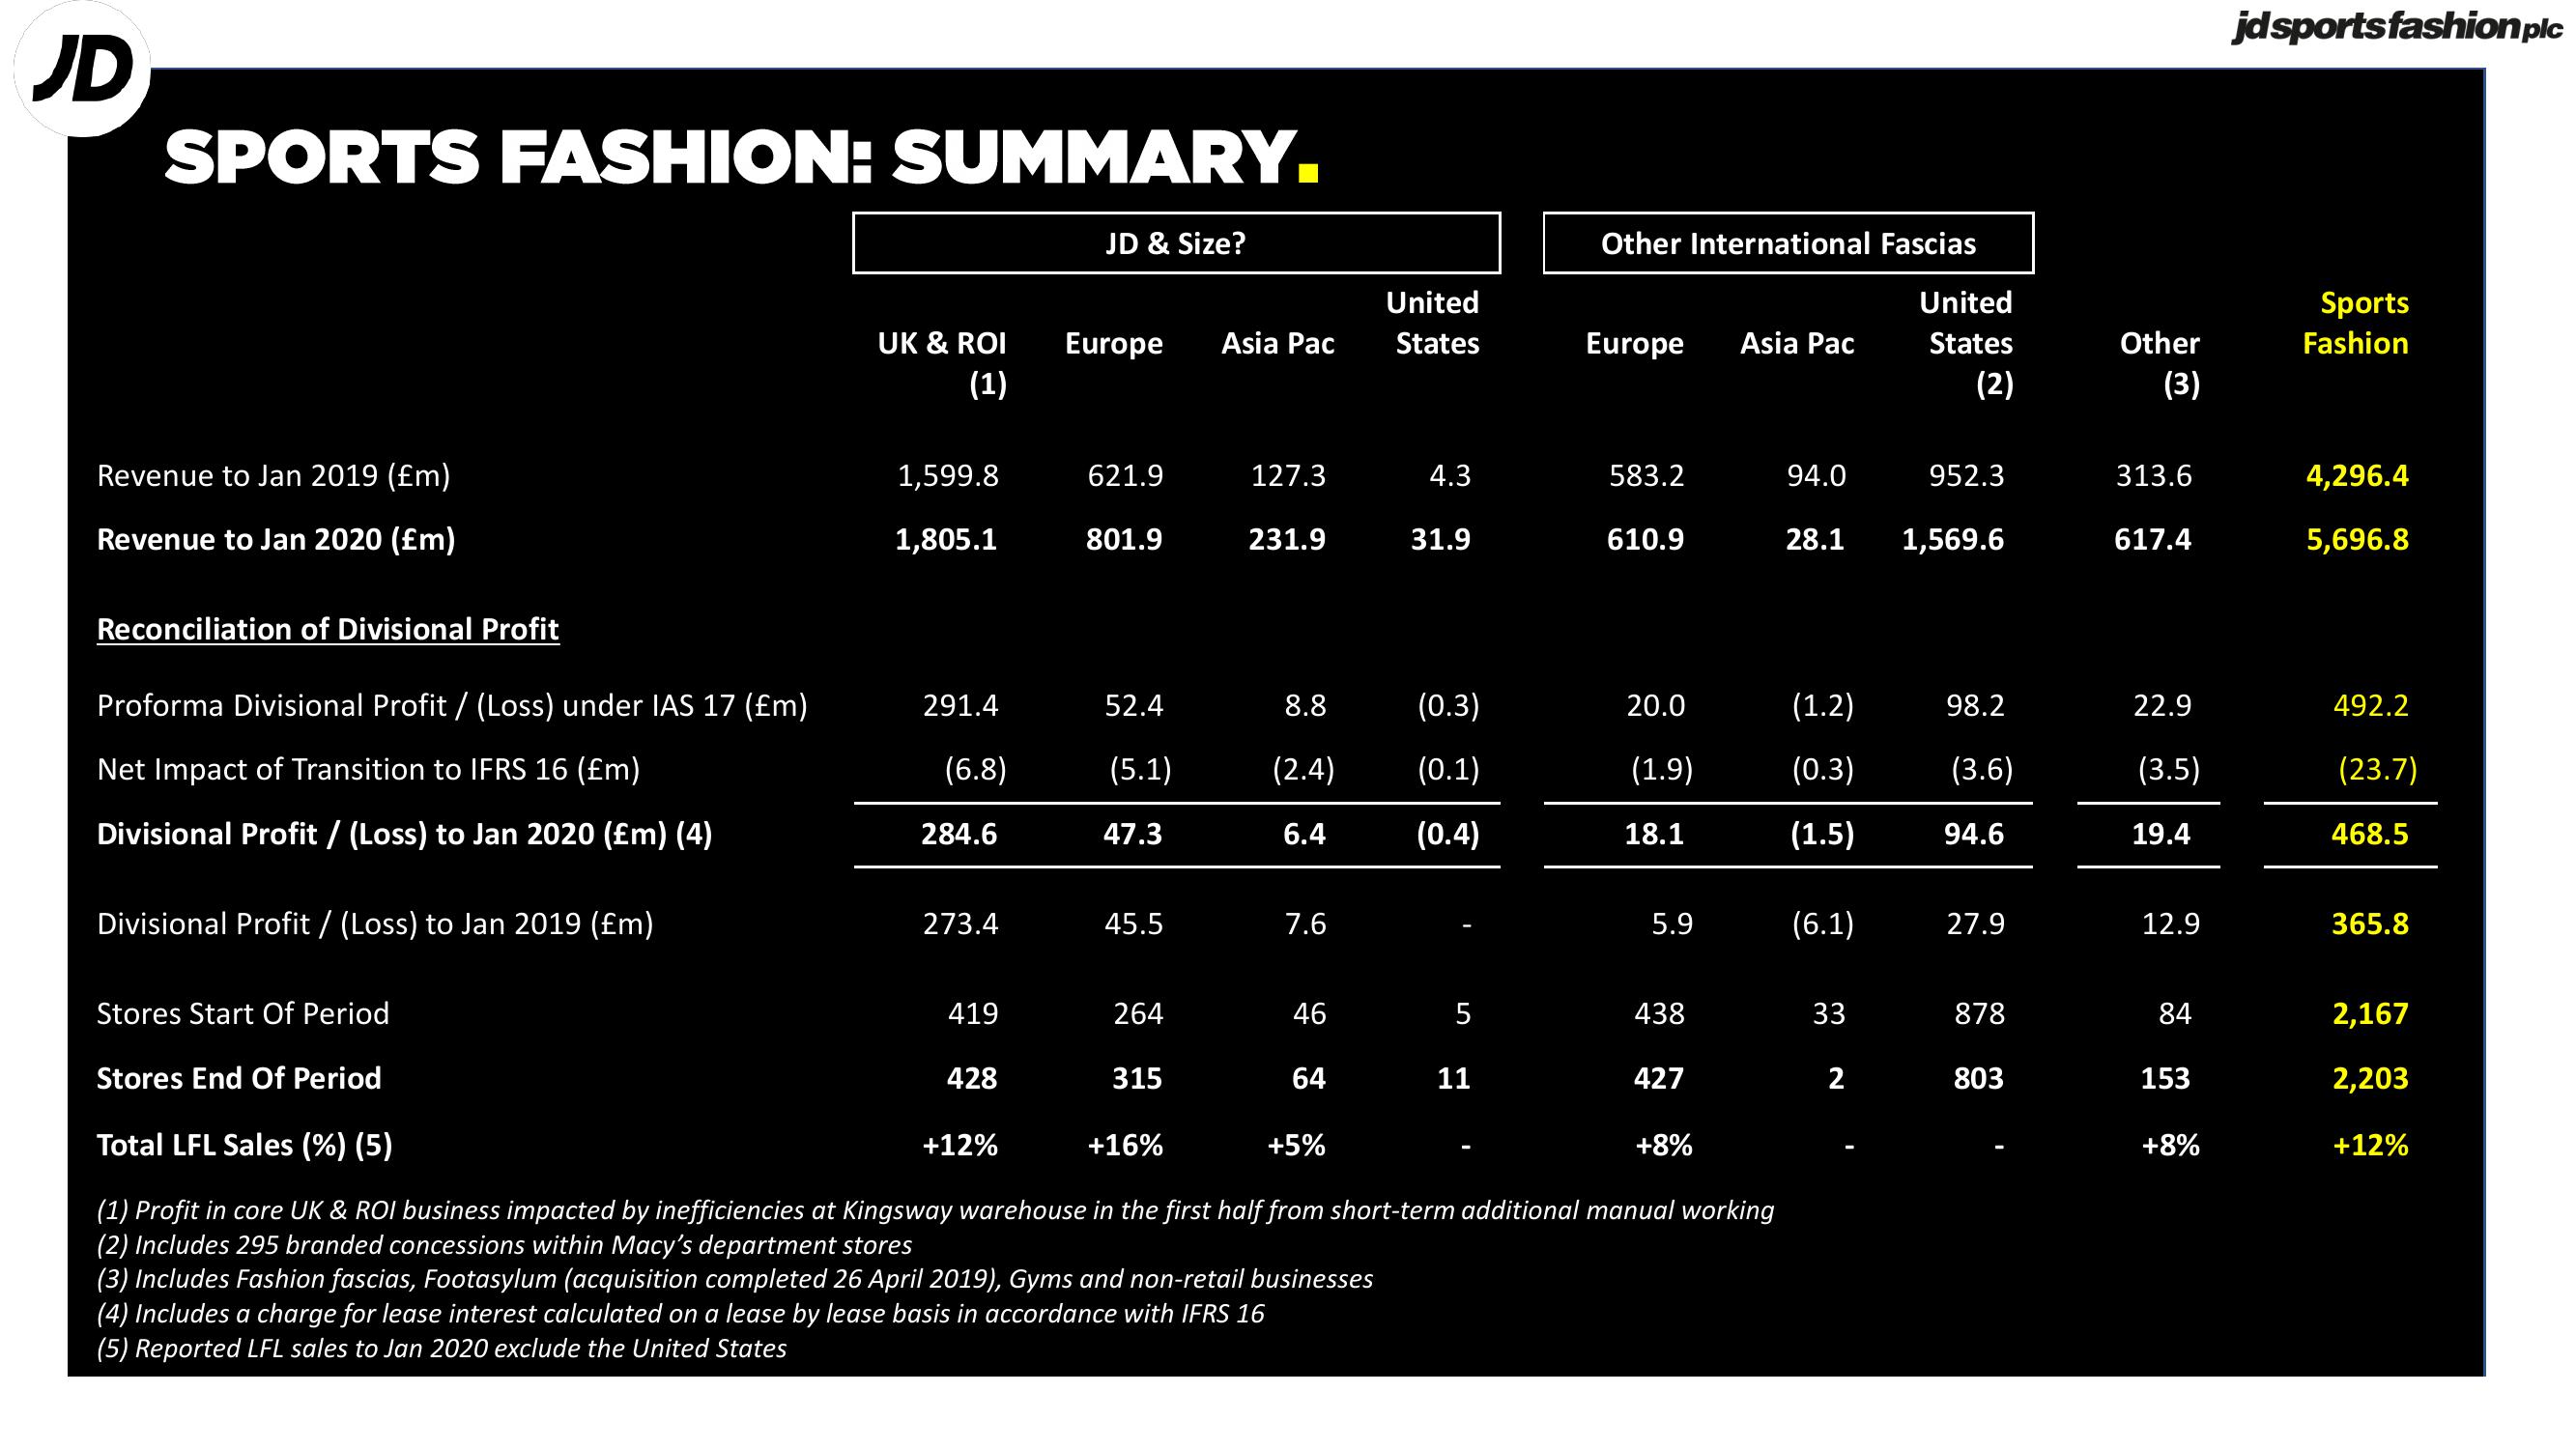
SPORTS FASHION: SUMMARY.
Revenue to Jan 2019 (£m)
Revenue to Jan 2020 (£m)
Reconciliation of Divisional Profit
Proforma Divisional Profit / (Loss) under IAS 17 (£m)
Net Impact of Transition to IFRS 16 (£m)
Divisional Profit / (Loss) to Jan 2020 (£m) (4)
Divisional Profit / (Loss) to Jan 2019 (£m)
UK & ROI
(1)
1,599.8
1,805.1
291.4
(6.8)
284.6
273.4
419
428
JD & Size?
+12%
Europe Asia Pac
621.9
801.9
52.4
(5.1)
47.3
45.5
264
315
127.3
+16%
231.9
7.6
United
States
8.8
(0.3)
(2.4) (0.1)
6.4
(0.4)
46
64
4.3
+5%
31.9
Stores Start Of Period
Stores End Of Period
Total LFL Sales (%) (5)
(1) Profit in core UK & ROI business impacted by inefficiencies at Kingsway warehouse in the first half from short-term additional manual working
(2) Includes 295 branded concessions within Macy's department stores
(3) Includes Fashion fascias, Footasylum (acquisition completed 26 April 2019), Gyms and non-retail businesses
(4) Includes a charge for lease interest calculated on a lease by lease basis in accordance with IFRS 16
(5) Reported LFL sales to Jan 2020 exclude the United States
5
Other International Fascias
United
States
(2)
11
Europe
583.2
610.9
20.0
(1.9)
18.1
5.9
438
427
Asia Pac
+8%
94.0
28.1 1,569.6
(1.2)
(0.3)
(1.5)
(6.1)
33
952.3
2
98.2
(3.6)
94.6
27.9
878
803
Other
(3)
313.6
617.4
22.9
(3.5)
19.4
12.9
84
153
+8%
jd sports fashion plc
Sports
Fashion
4,296.4
5,696.8
492.2
(23.7)
468.5
365.8
2,167
2,203
+12%View entire presentation