Zenvia IPO
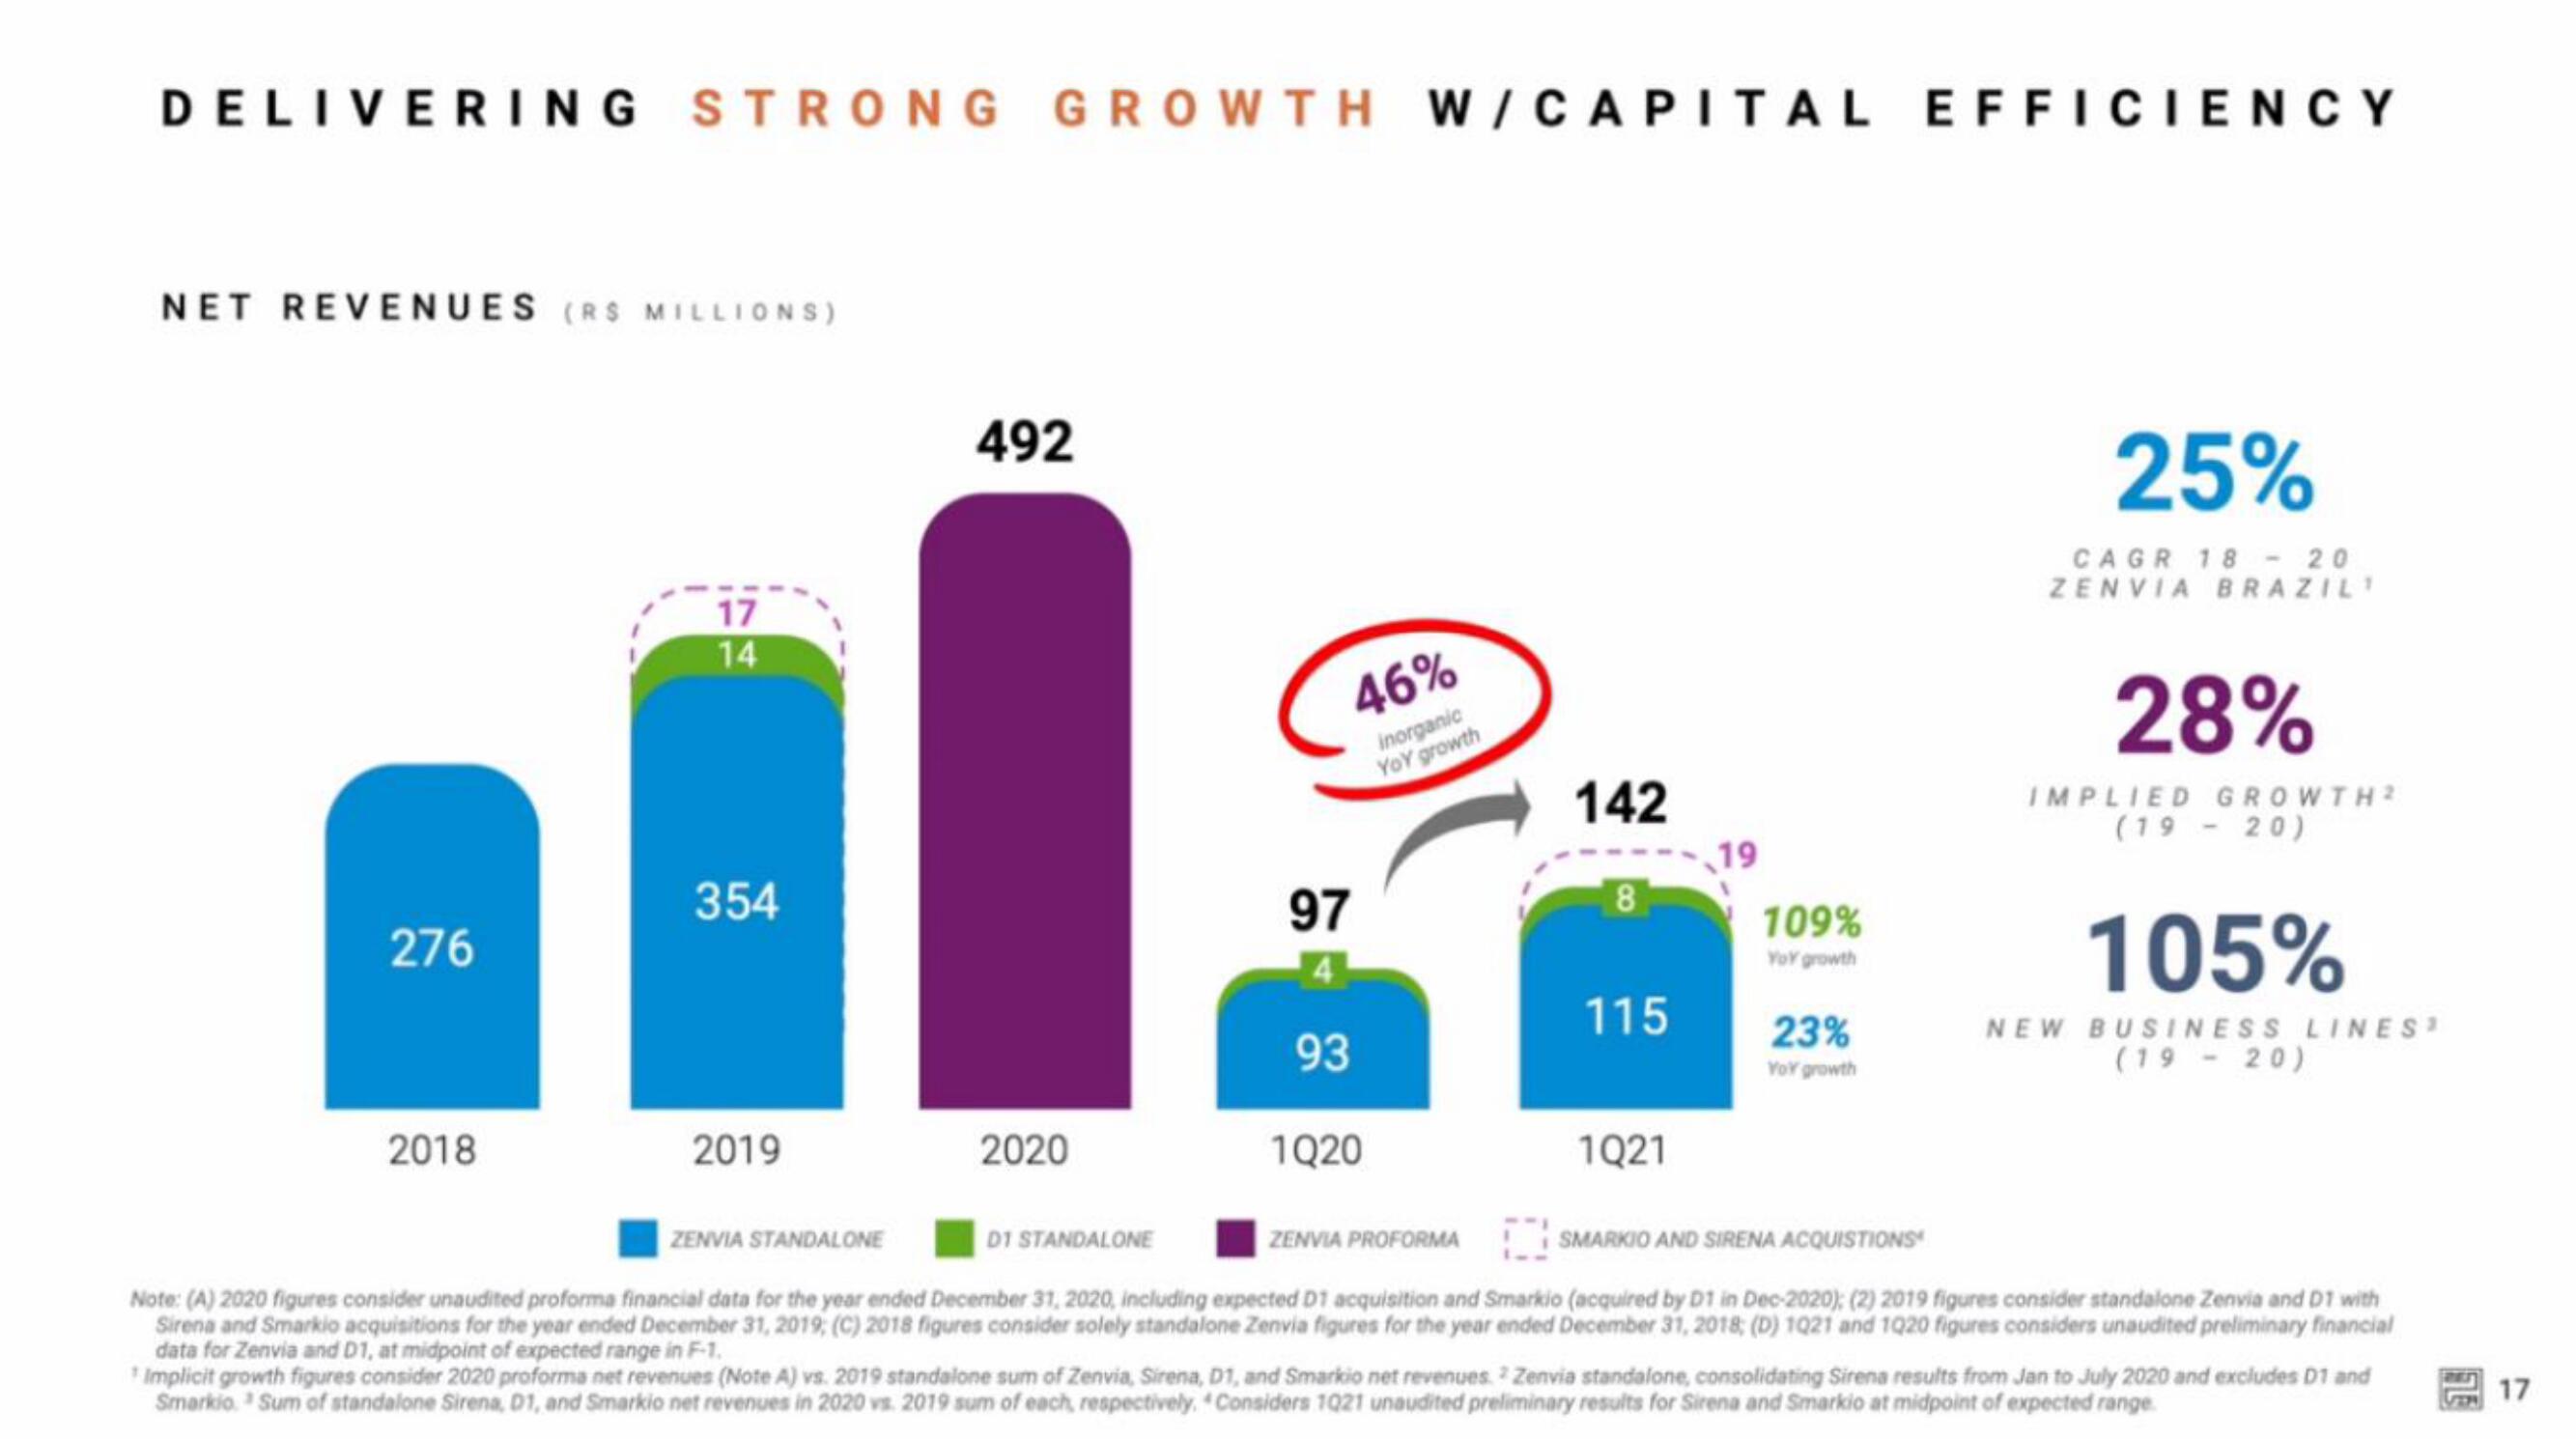
DELIVERING STRONG GROWTH W/CAPITAL EFFICIENCY
NET REVENUES (RS MILLIONS)
276
2018
17
14
354
2019
492
2020
46%
inorganic
YOY growth
97
4
93
1020
142
8
115
1Q21
19
109%
Yoy growth
23%
Voy growth
25%
CAGR 18 20
ZENVIA BRAZILI
28%
IMPLIED GROWTH 2
(19 - 20)
105%
NEW BUSINESS LINES
(19-20)
ZENVIA STANDALONE
D1 STANDALONE
ZENVIA PROFORMA
SMARKIO AND SIRENA ACQUISTIONS
Note: (A) 2020 figures consider unaudited proforma financial data for the year ended December 31, 2020, including expected D1 acquisition and Smarkio (acquired by D1 in Dec-2020); (2) 2019 figures consider standalone Zenvia and D1 with
Sirena and Smarkio acquisitions for the year ended December 31, 2019; (C) 2018 figures consider solely standalone Zenvia figures for the year ended December 31, 2018; (D) 1021 and 1020 figures considers unaudited preliminary financial
data for Zenvia and D1, at midpoint of expected range in F-1.
¹ Implicit growth figures consider 2020 proforma net revenues (Note A) vs. 2019 standalone sum of Zenvia, Sirena, D1, and Smarkio net revenues Zenvia standalone, consolidating Sirena results from Jan to July 2020 and excludes D1 and
Smarkio. Sum of standalone Sirena, D1, and Smarkio net revenues in 2020 vs. 2019 sum of each, respectively. Considers 1021 unaudited preliminary results for Sirena and Smarkio at midpoint of expected range.
17View entire presentation