Lanvin Results Presentation Deck
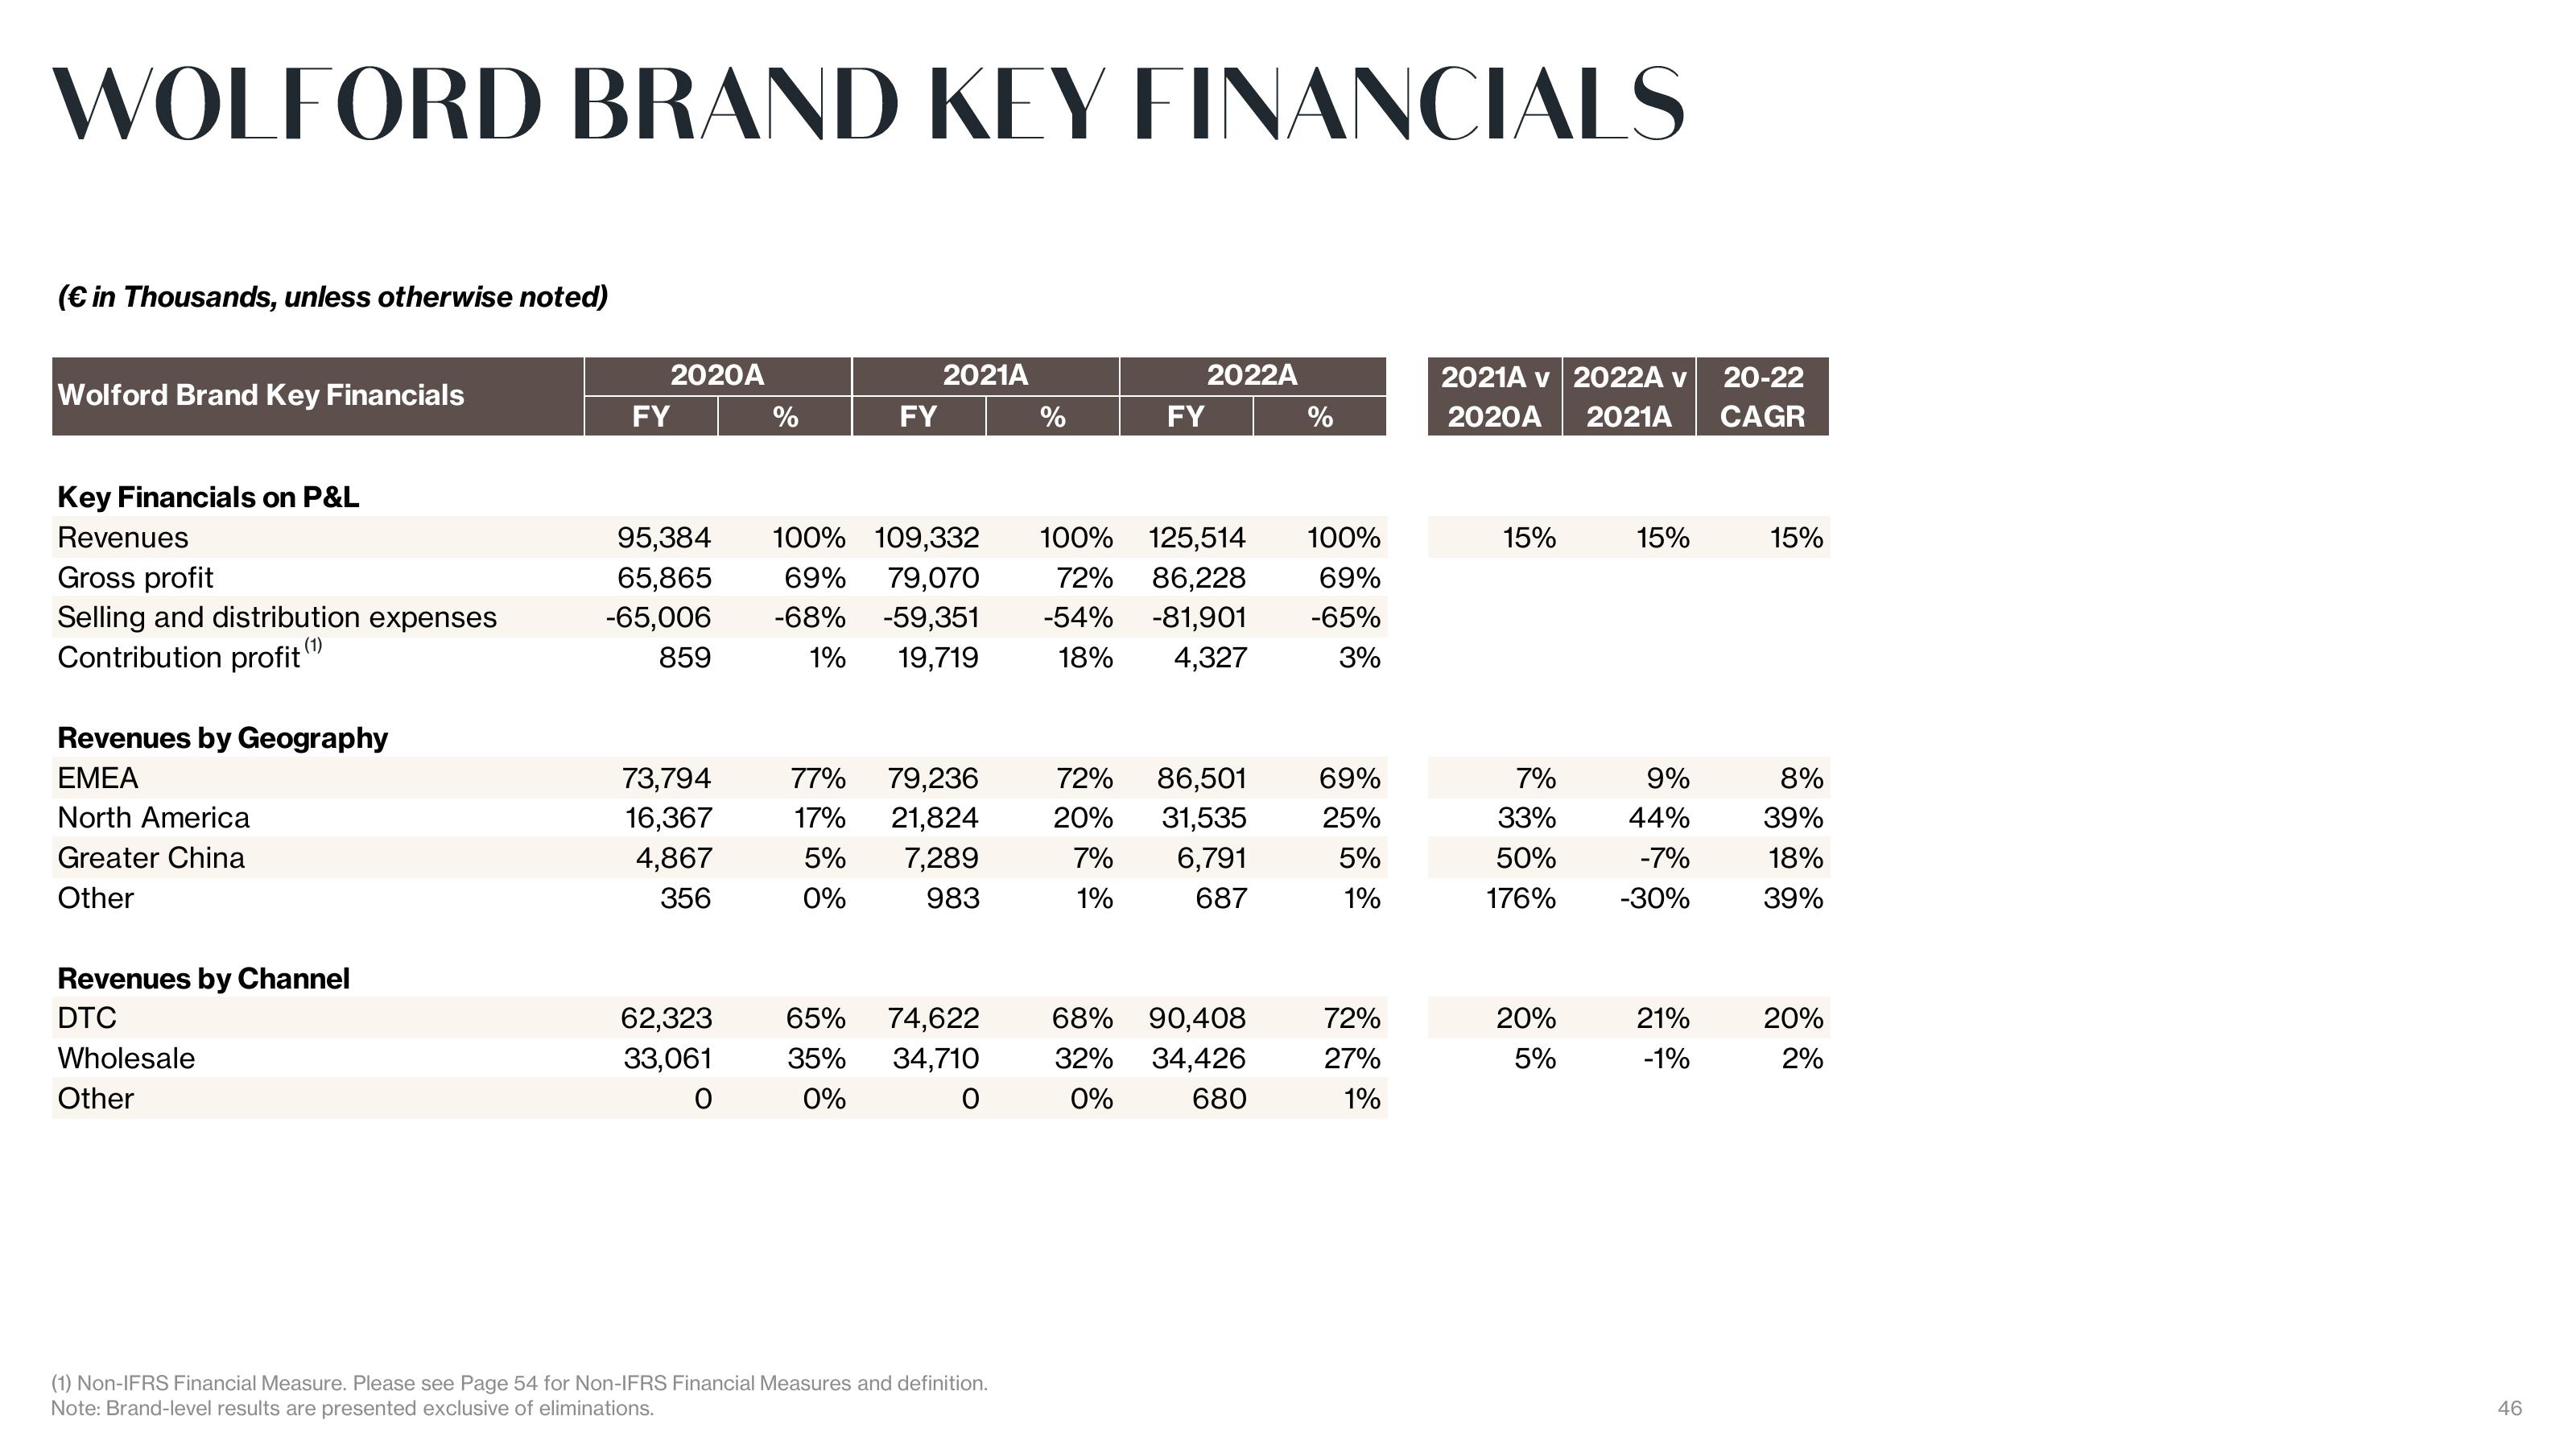
WOLFORD BRAND KEY FINANCIALS
(€ in Thousands, unless otherwise noted)
Wolford Brand Key Financials
Key Financials on P&L
Revenues
Gross profit
Selling and distribution expenses
Contribution profit (1)
Revenues by Geography
EMEA
North America
Greater China
Other
Revenues by Channel
DTC
Wholesale
Other
2020A
FY
73,794
16,367
4,867
356
%
62,323
33,061
O
FY
2021A
72% 86,228
65,865
-65,006
95,384 100% 109,332 100% 125,514
69% 79,070
-68% -59,351
1%
19,719
-54% -81,901
859
18% 4,327
77% 79,236
17% 21,824
5% 7,289
0% 983
65% 74,622
35% 34,710
0%
0
%
(1) Non-IFRS Financial Measure. Please see Page 54 for Non-IFRS Financial Measures and definition.
Note: Brand-level results are presented exclusive of eliminations.
2022A
FY
72% 86,501
20%
7%
1%
31,535
6,791
687
68% 90,408
32% 34,426
0%
680
%
100%
69%
-65%
3%
69%
25%
5%
1%
72%
27%
1%
2021A v 2022A v
2020A 2021A
15%
7%
33%
50%
176%
20%
5%
15%
9%
44%
-7%
-30%
21%
-1%
20-22
CAGR
15%
8%
39%
18%
39%
20%
2%
46View entire presentation