Allwyn Investor Update
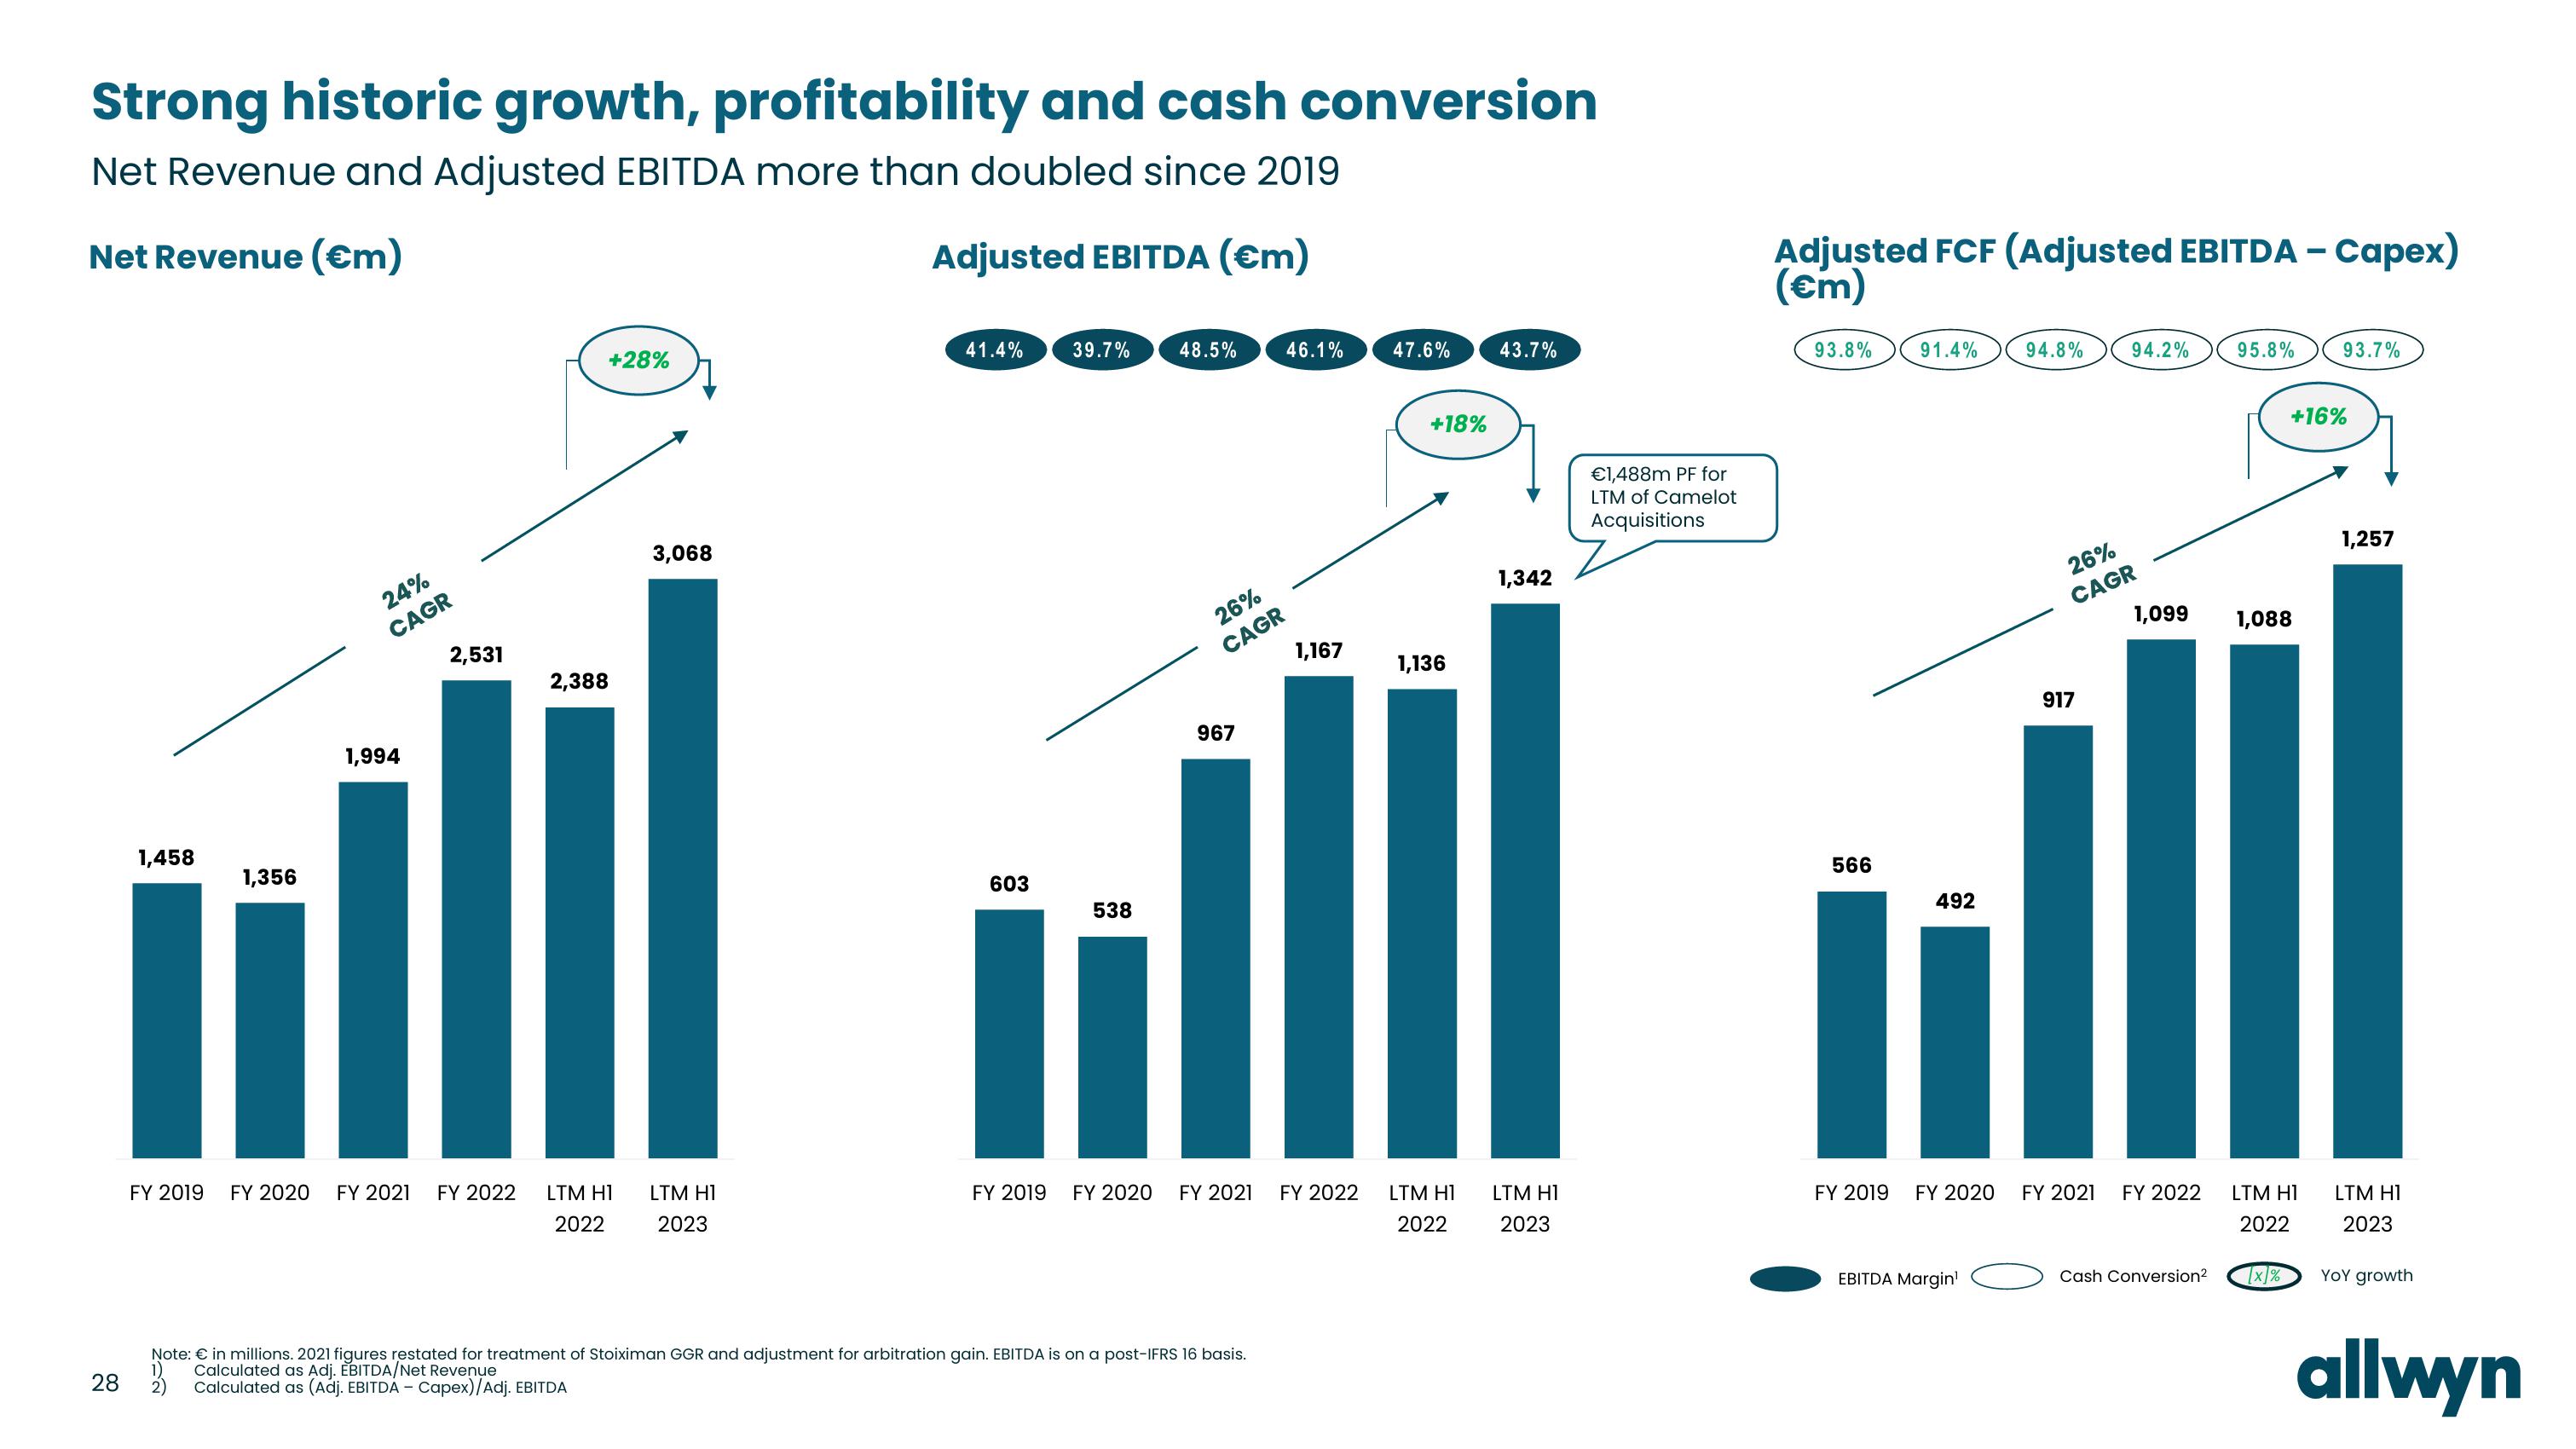
Strong historic growth, profitability and cash conversion
Net Revenue and Adjusted EBITDA more than doubled since 2019
Net Revenue (€m)
Adjusted EBITDA (€m)
28
1,458
FY 2019
1,356
24%
CAGR
1,994
2,531
2,388
+28%
3,068
FY 2020 FY 2021 FY 2022 LTM H1 LTM H1
2023
2022
41.4%
603
39.7% 48.5%
538
26%
CAGR
967
46.1%
Note: € in millions. 2021 figures restated for treatment of Stoiximan GGR and adjustment for arbitration gain. EBITDA is on a post-IFRS 16 basis.
1) Calculated as Adj. EBITDA/Net Revenue
2)
Calculated as (Adj. EBITDA - Capex)/Adj. EBITDA
1,167
FY 2019 FY 2020 FY 2021 FY 2022
47.6%
+18%
1,136
LTM H1
2022
43.7%
1,342
LTM H1
2023
€1,488m PF for
LTM of Camelot
Acquisitions
Adjusted FCF (Adjusted EBITDA - Capex)
(€m)
93.8%
91.4%
566
492
11
FY 2019
FY 2020
EBITDA Margin¹
94.8%
26%
CAGR
917
FY 2021
94.2%
FY 2022
95.8%
1,099 1,088
Cash Conversion²
+16%
93.7%
LTM H1
2022
[x]%
1,257
LTM H1
2023
YOY growth
allwynView entire presentation