Altus Power Investor Presentation Deck
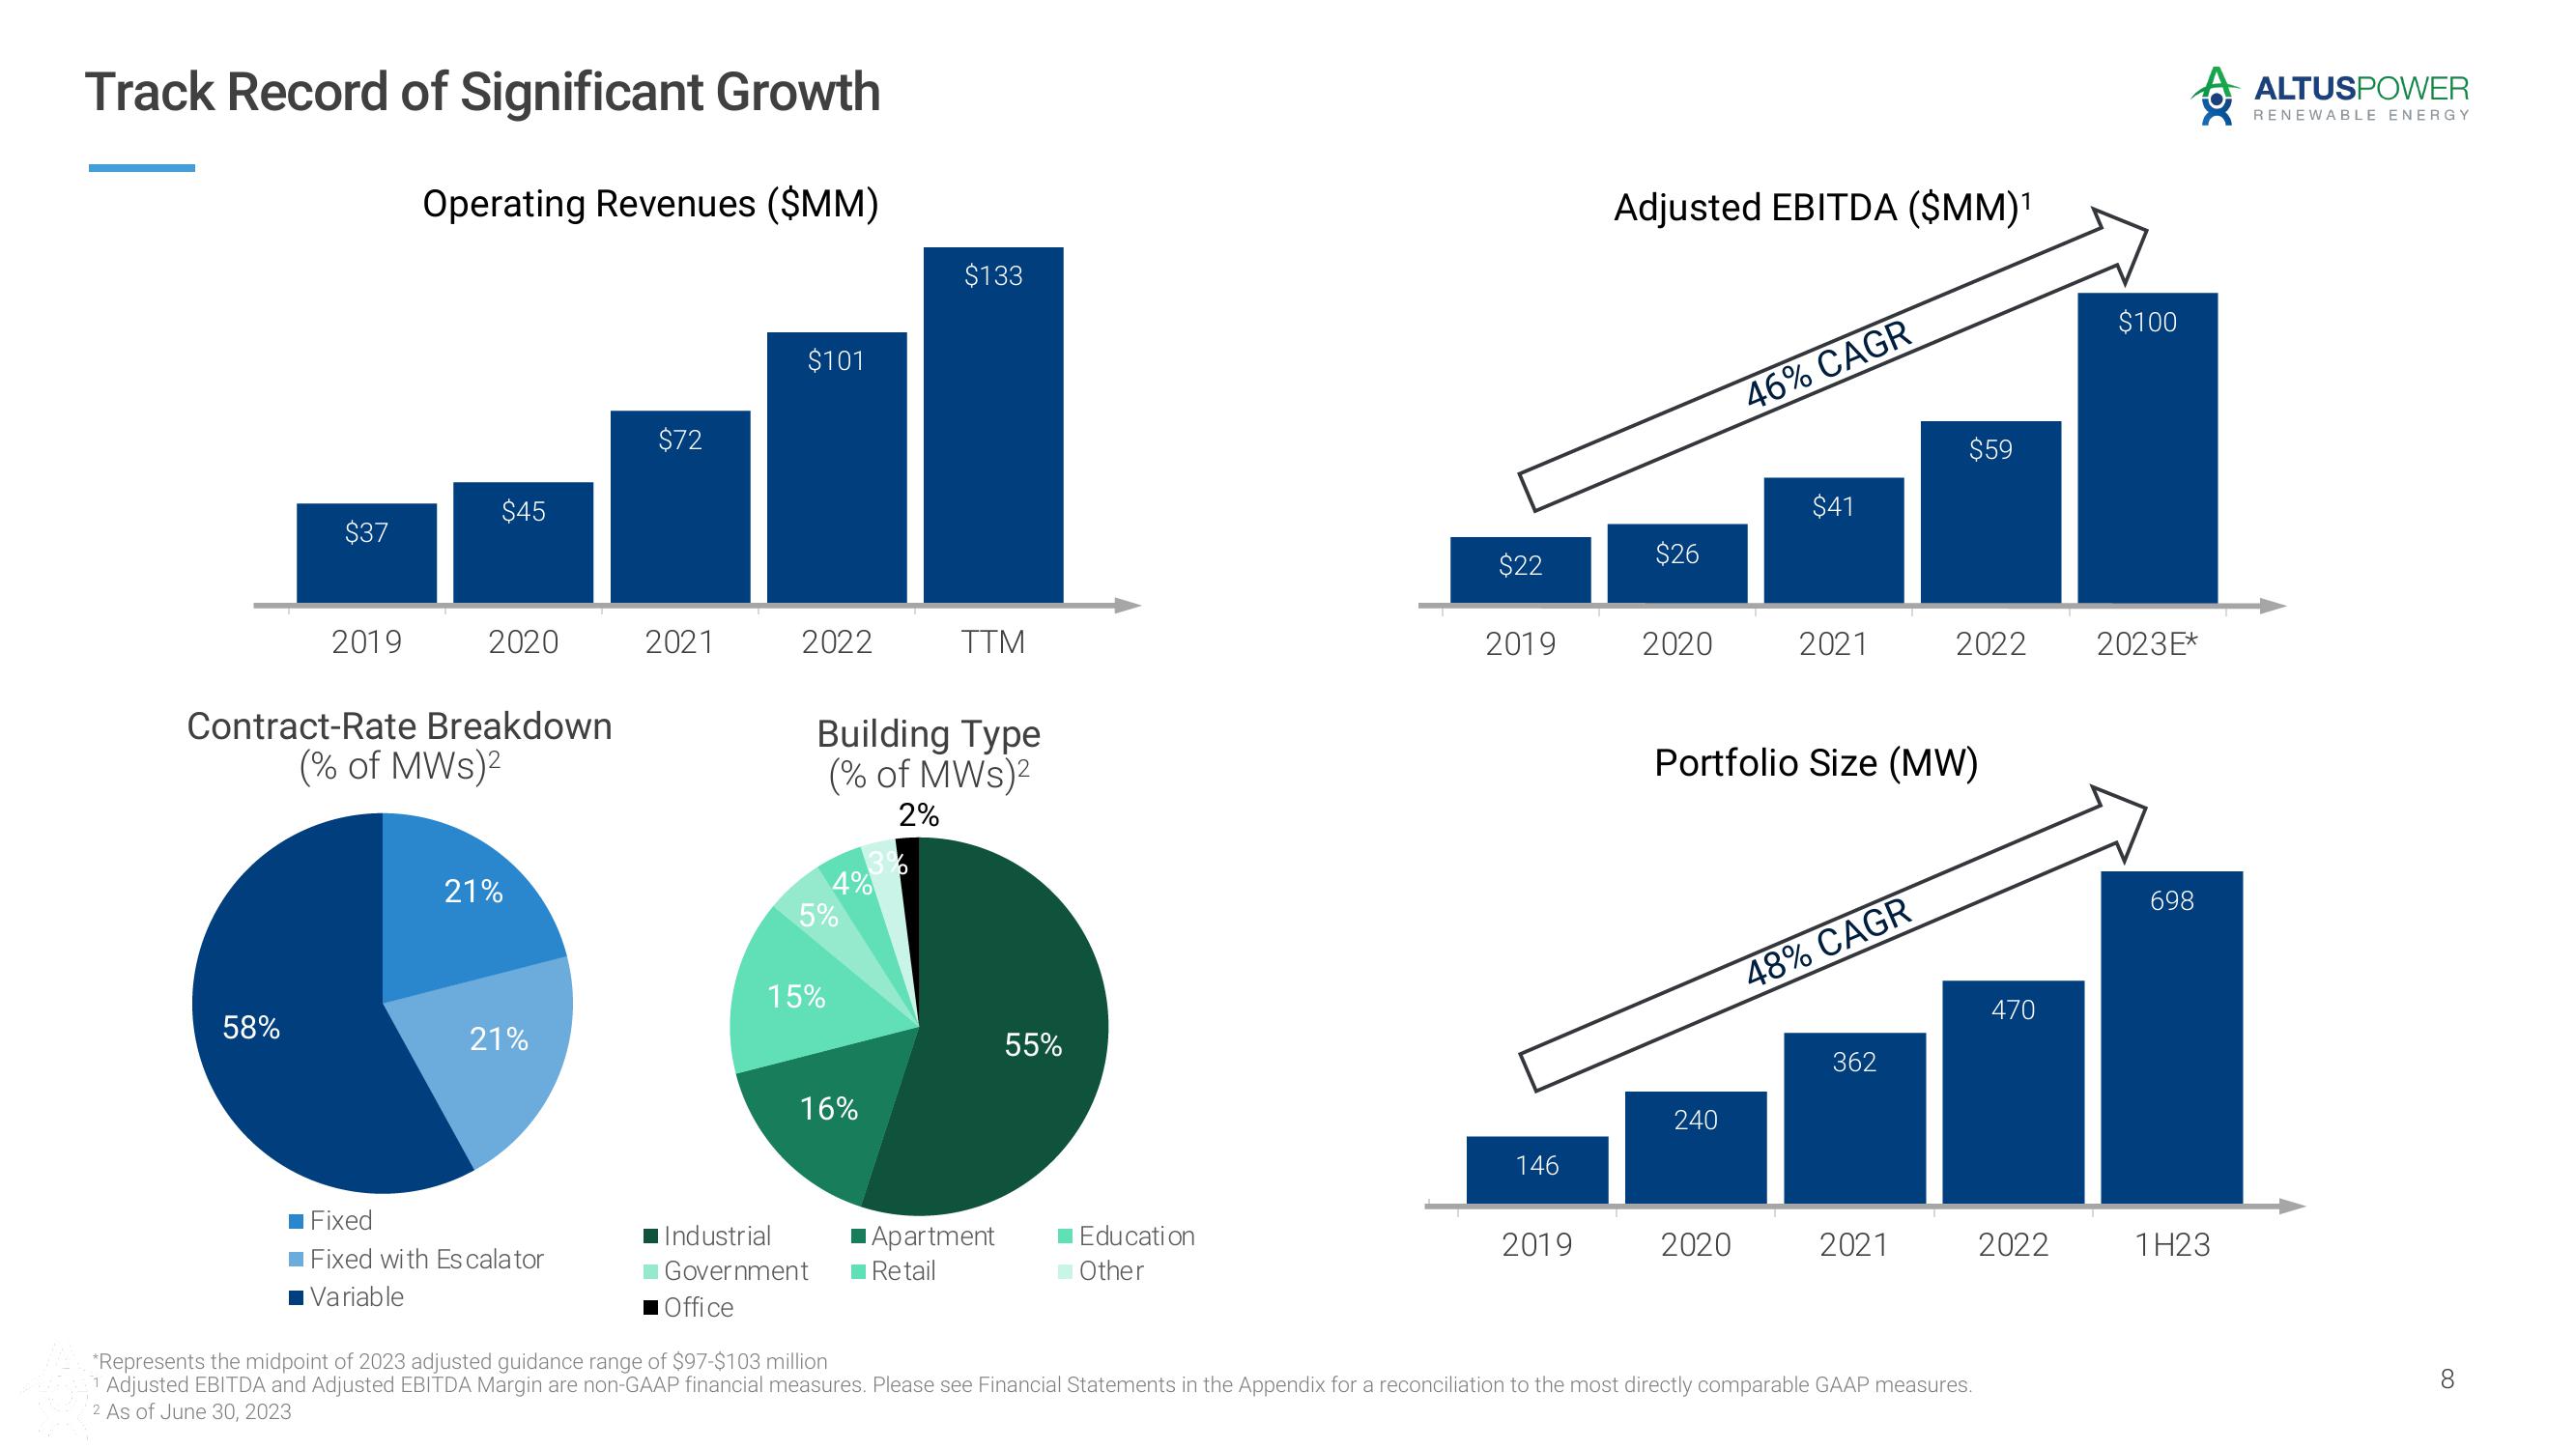
Track Record of Significant Growth
Operating Revenues ($MM)
$37
58%
2019
$45
2020
Contract-Rate Breakdown
(% of MWs)²
21%
21%
Fixed
Fixed with Es calator
Variable
$72
2021
$101
2022
5%
15%
Building Type
(% of MWS)²
2%
Industrial
Government
Office
4%
16%
3%
$133
TTM
Apartment
Retail
55%
Education
Other
$22
2019
146
2019
Adjusted EBITDA ($MM)¹
$26
2020
240
46% CAGR
2020
$41
2021
Portfolio Size (MW)
48% CAGR
362
$59
2021
2022
*Represents the midpoint of 2023 adjusted guidance range of $97-$103 million
1 Adjusted EBITDA and Adjusted EBITDA Margin are non-GAAP financial measures. Please see Financial Statements in the Appendix for a reconciliation to the most directly comparable GAAP measures.
2 As of June 30, 2023
470
2022
$100
2023E*
698
1H23
ALTUSPOWER
RENEWABLE ENERGY
8View entire presentation