Uber Results Presentation Deck
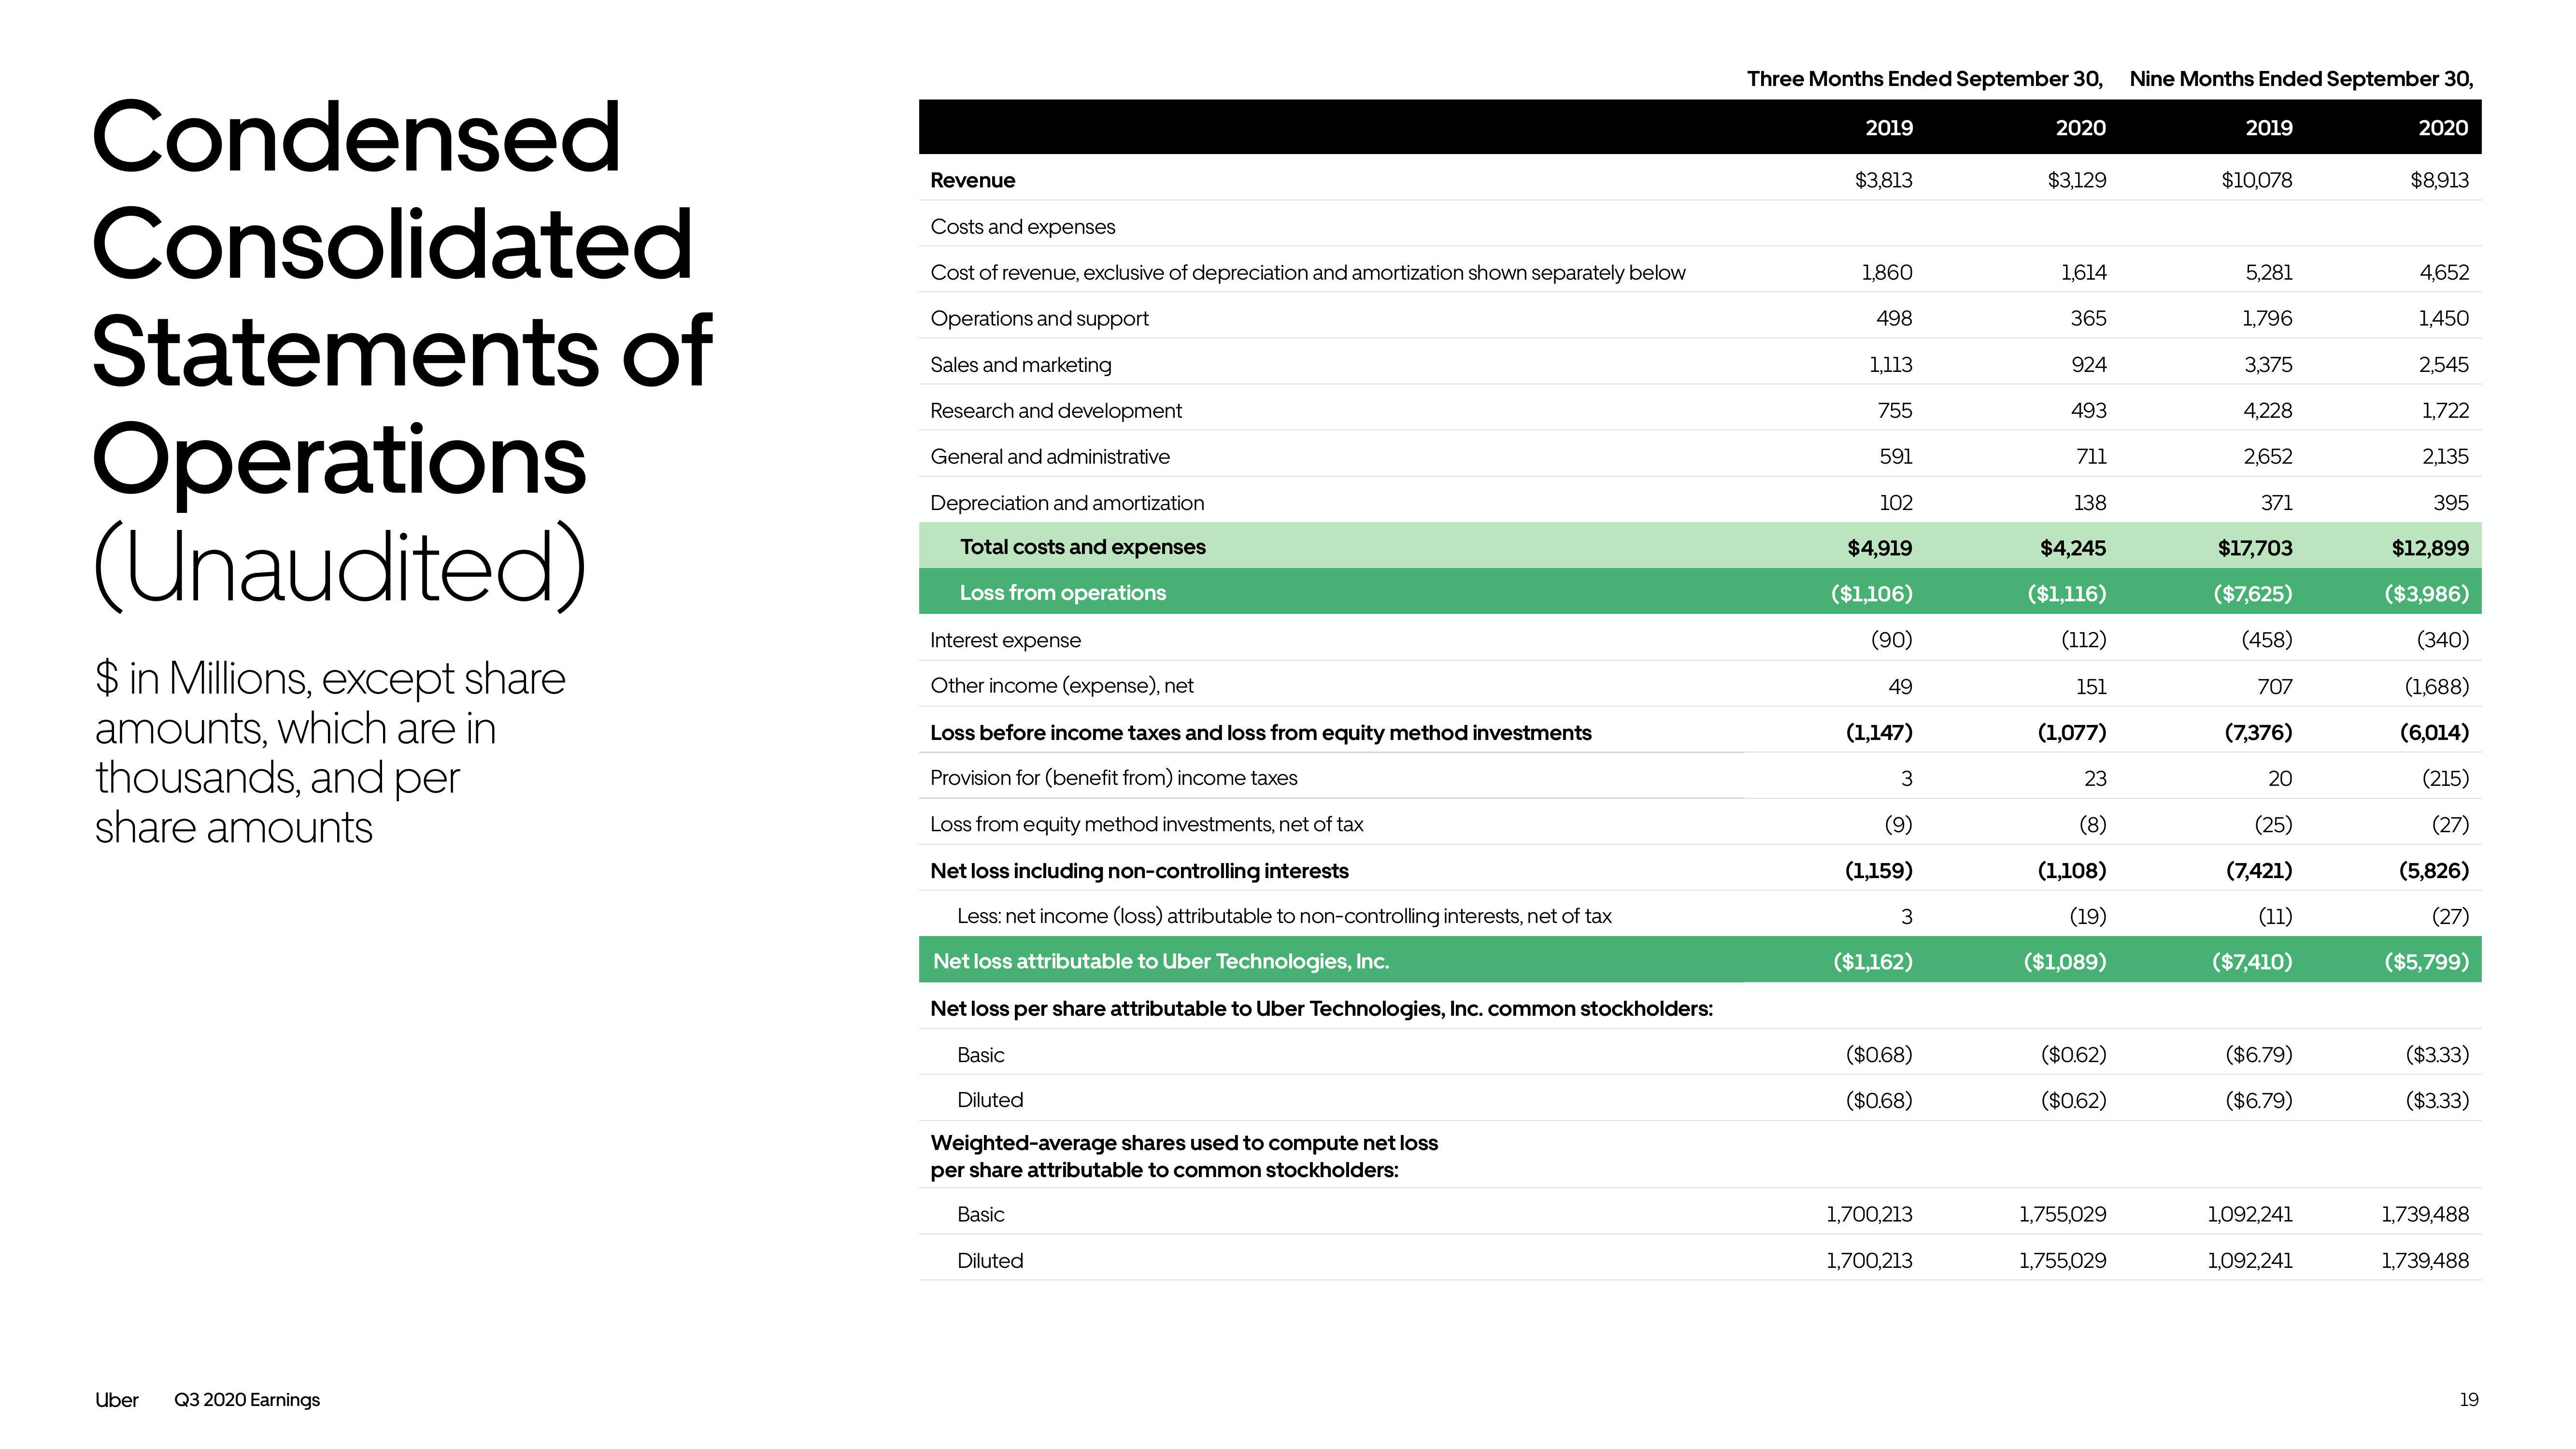
Condensed
Consolidated
Statements of
Operations
(Unaudited)
$ in Millions, except share
amounts, which are in
thousands, and per
share amounts
Uber Q3 2020 Earnings
Revenue
Costs and expenses
Cost of revenue, exclusive of depreciation and amortization shown separately below
Operations and support
Sales and marketing
Research and development
General and administrative
Depreciation and amortization
Total costs and expenses
Loss from operations
Interest expense
Other income (expense), net
Loss before income taxes and loss from equity method investments
Provision for (benefit from) income taxes
Loss from equity method investments, net of tax
Net loss including non-controlling interests
Less: net income (loss) attributable to non-controlling interests, net of tax
Net loss attributable to Uber Technologies, Inc.
Net loss per share attributable to Uber Technologies, Inc. common stockholders:
Basic
Diluted
Weighted-average shares used to compute net loss
per share attributable to common stockholders:
Basic
Diluted
Three Months Ended September 30, Nine Months Ended September 30,
2020
2019
$3,813
1,860
498
1.113
755
591
102
$4,919
($1,106)
(90)
49
(1,147)
3
(9)
(1,159)
3
($1,162)
($0.68)
($0.68)
1,700,213
1,700,213
$3,129
1,614
365
924
493
711
138
$4,245
($1,116)
(112)
151
(1,077)
23
(8)
(1,108)
(19)
($1,089)
($0.62)
($0.62)
1,755,029
1,755,029
2019
$10,078
5,281
1,796
3,375
4,228
2,652
371
$17,703
($7,625)
(458)
707
(7,376)
20
(25)
(7,421)
(11)
($7,410)
($6.79)
($6.79)
1,092,241
1,092,241
2020
$8,913
4,652
1,450
2,545
1,722
2,135
395
$12,899
($3,986)
(340)
(1,688)
(6,014)
(215)
(27)
(5,826)
(27)
($5,799)
($3.33)
($3.33)
1,739,488
1,739,488
19View entire presentation