Perfect SPAC Presentation Deck
PERFECT
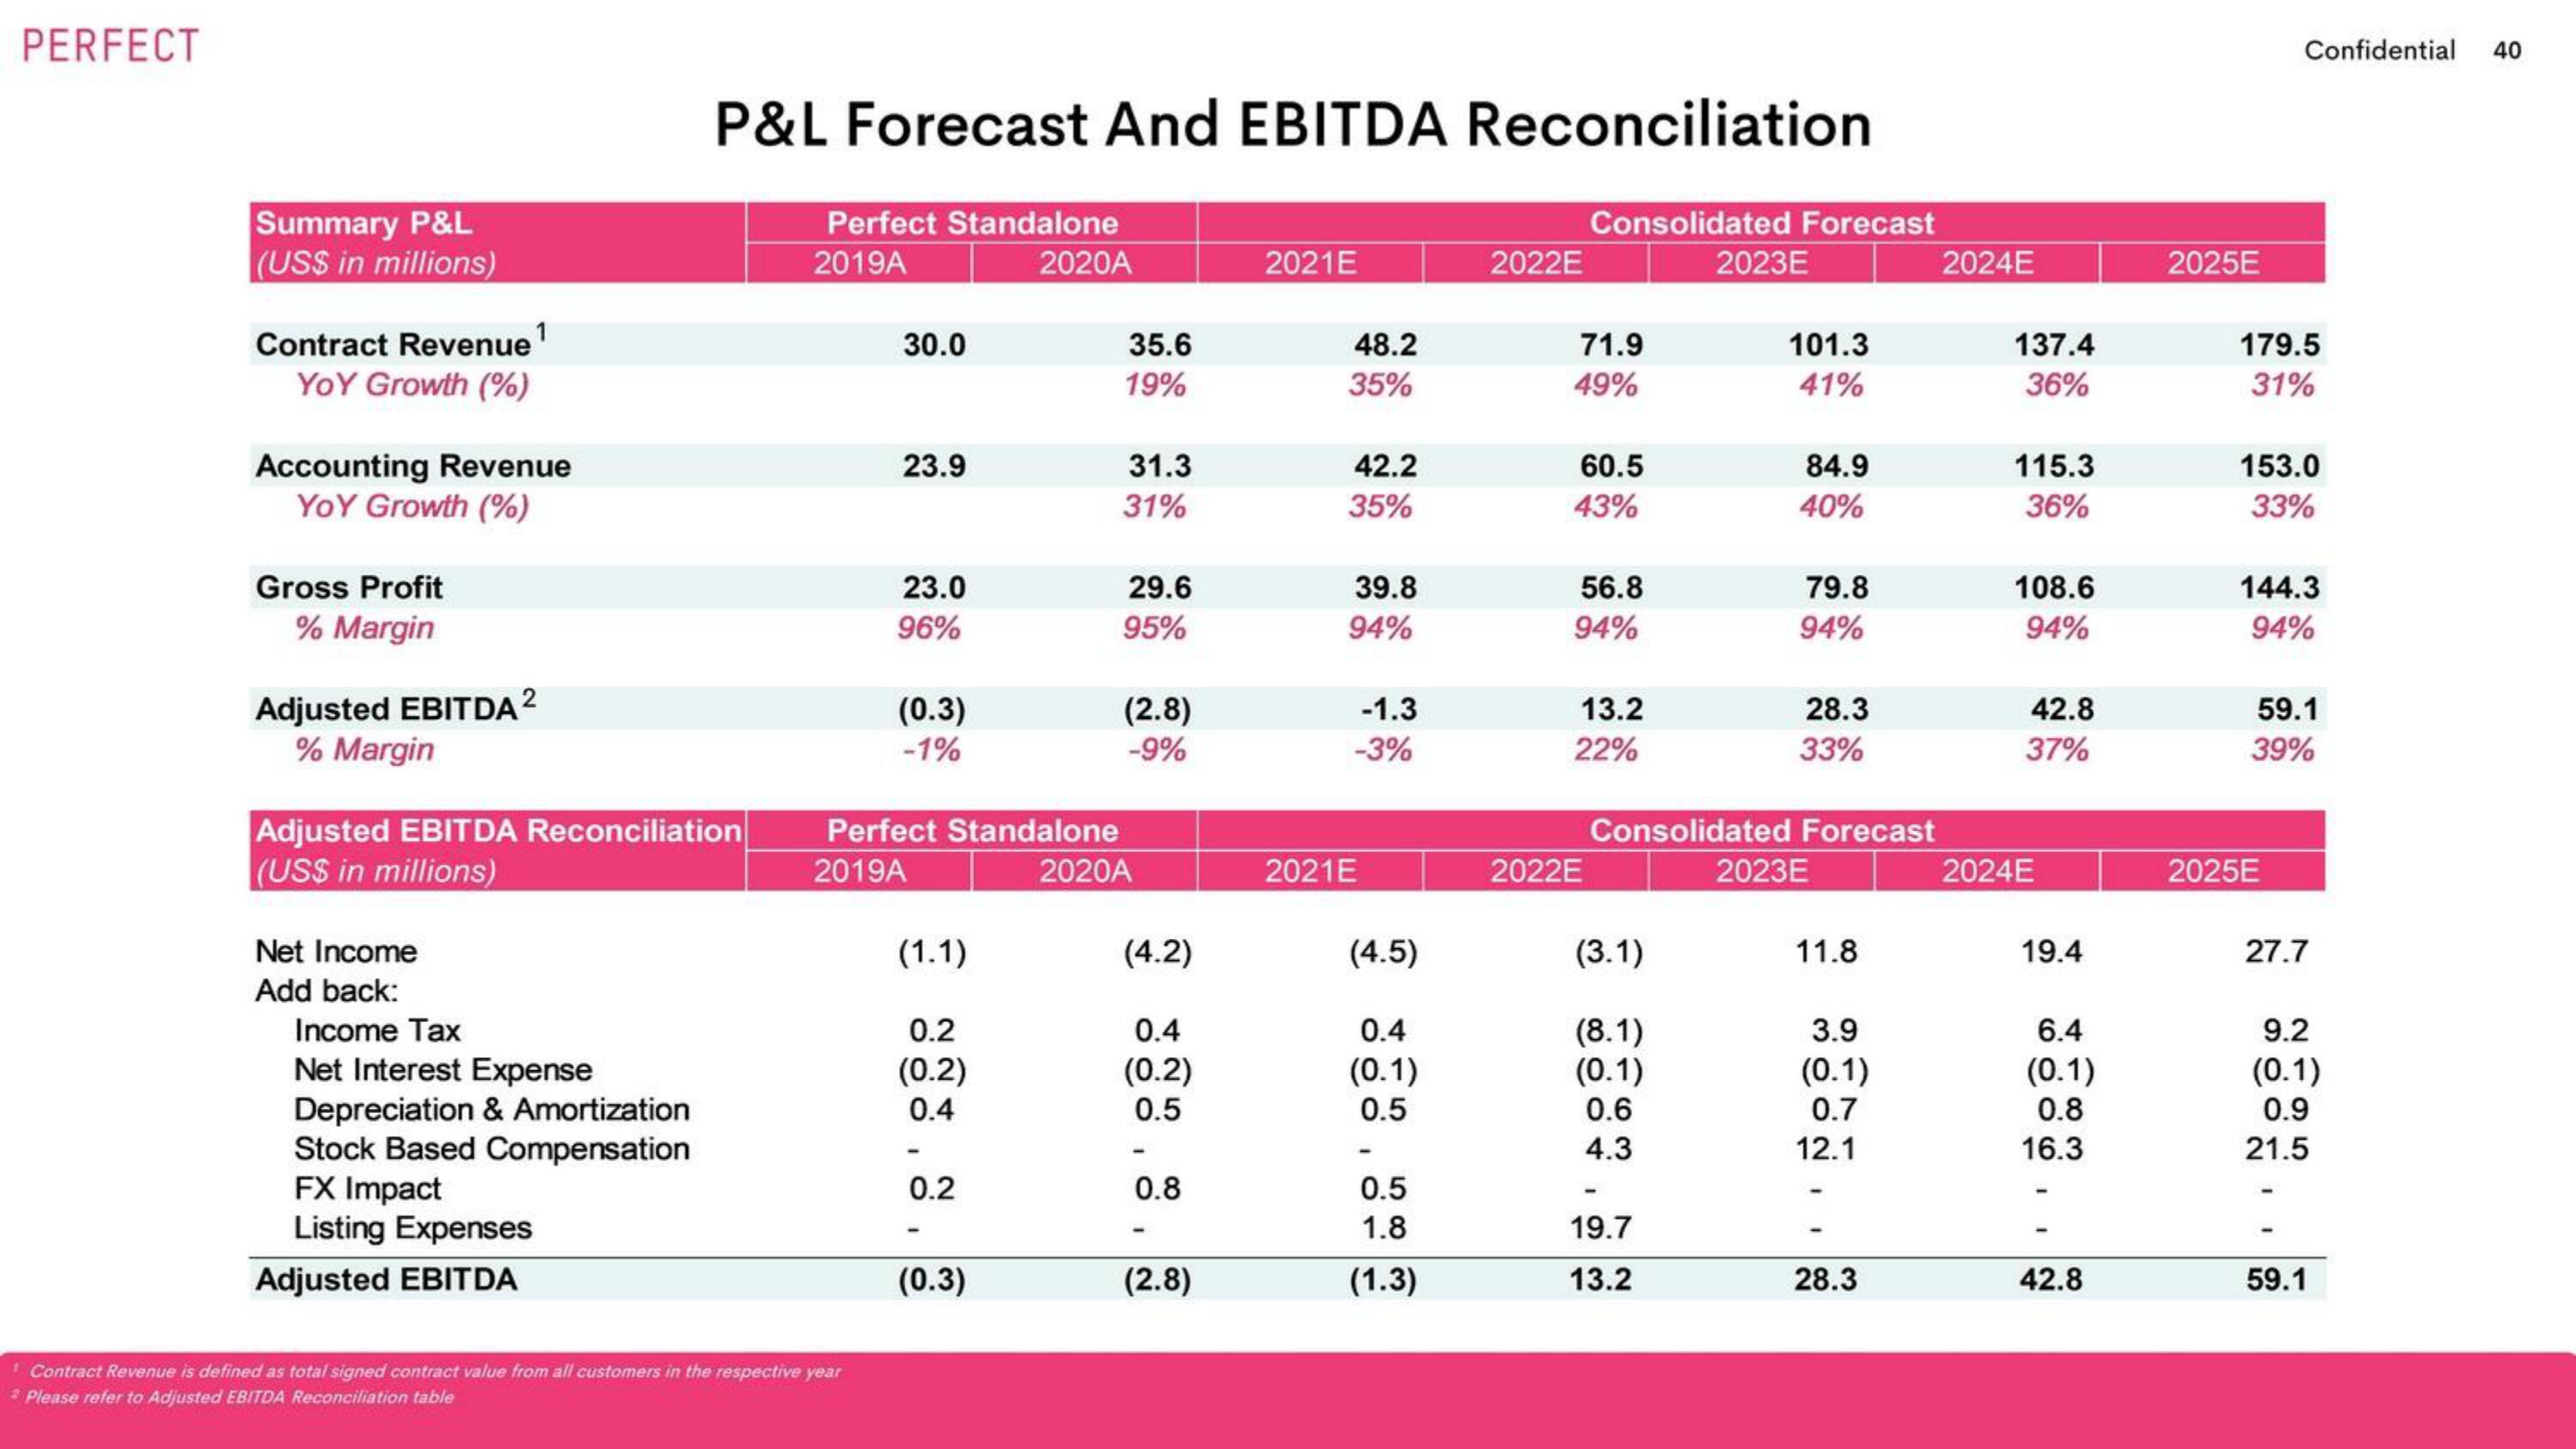
Summary P&L
(US$ in millions)
Contract Revenue ¹
YOY Growth (%)
Accounting Revenue
YOY Growth (%)
Gross Profit
% Margin
Adjusted EBITDA ²
% Margin
Adjusted EBITDA Reconciliation
(US$ in millions)
Net Income
Add back:
Income Tax
P&L Forecast And EBITDA Reconciliation
Net Interest Expense
Depreciation & Amortization
Stock Based Compensation
FX Impact
Listing Expenses
Adjusted EBITDA
Perfect Standalone
2019A
2020A
30.0
¹ Contract Revenue is defined as total signed contract value from all customers in the respective year
* Please refer to Adjusted EBITDA Reconciliation table
23.9
23.0
96%
(0.3)
-1%
(1.1)
0.2
(0.2)
0.4
Perfect Standalone
2019A
2020A
0.2
35.6
19%
(0.3)
31.3
31%
29.6
95%
(2.8)
-9%
(4.2)
0.4
(0.2)
0.5
0.8
(2.8)
2021E
48.2
35%
42.2
35%
39.8
94%
-1.3
-3%
2021E
(4.5)
0.4
(0.1)
0.5
0.5
1.8
(1.3)
2022E
Consolidated Forecast
71.9
49%
60.5
43%
56.8
94%
13.2
22%
2022E
(3.1)
(8.1)
(0.1)
0.6
4.3
2023E
19.7
13.2
101.3
41%
84.9
40%
79.8
94%
Consolidated Forecast
28.3
33%
2023E
11.8
3.9
(0.1)
0.7
12.1
28.3
2024E
137.4
36%
115.3
36%
108.6
94%
42.8
37%
2024E
19.4
6.4
(0.1)
0.8
16.3
42.8
2025E
Confidential 40
179.5
31%
153.0
33%
144.3
94%
59.1
39%
2025E
27.7
9.2
(0.1)
0.9
21.5
59.1View entire presentation