Granite Ridge Investor Presentation Deck
Overview
Strategy & Execution
Appendix
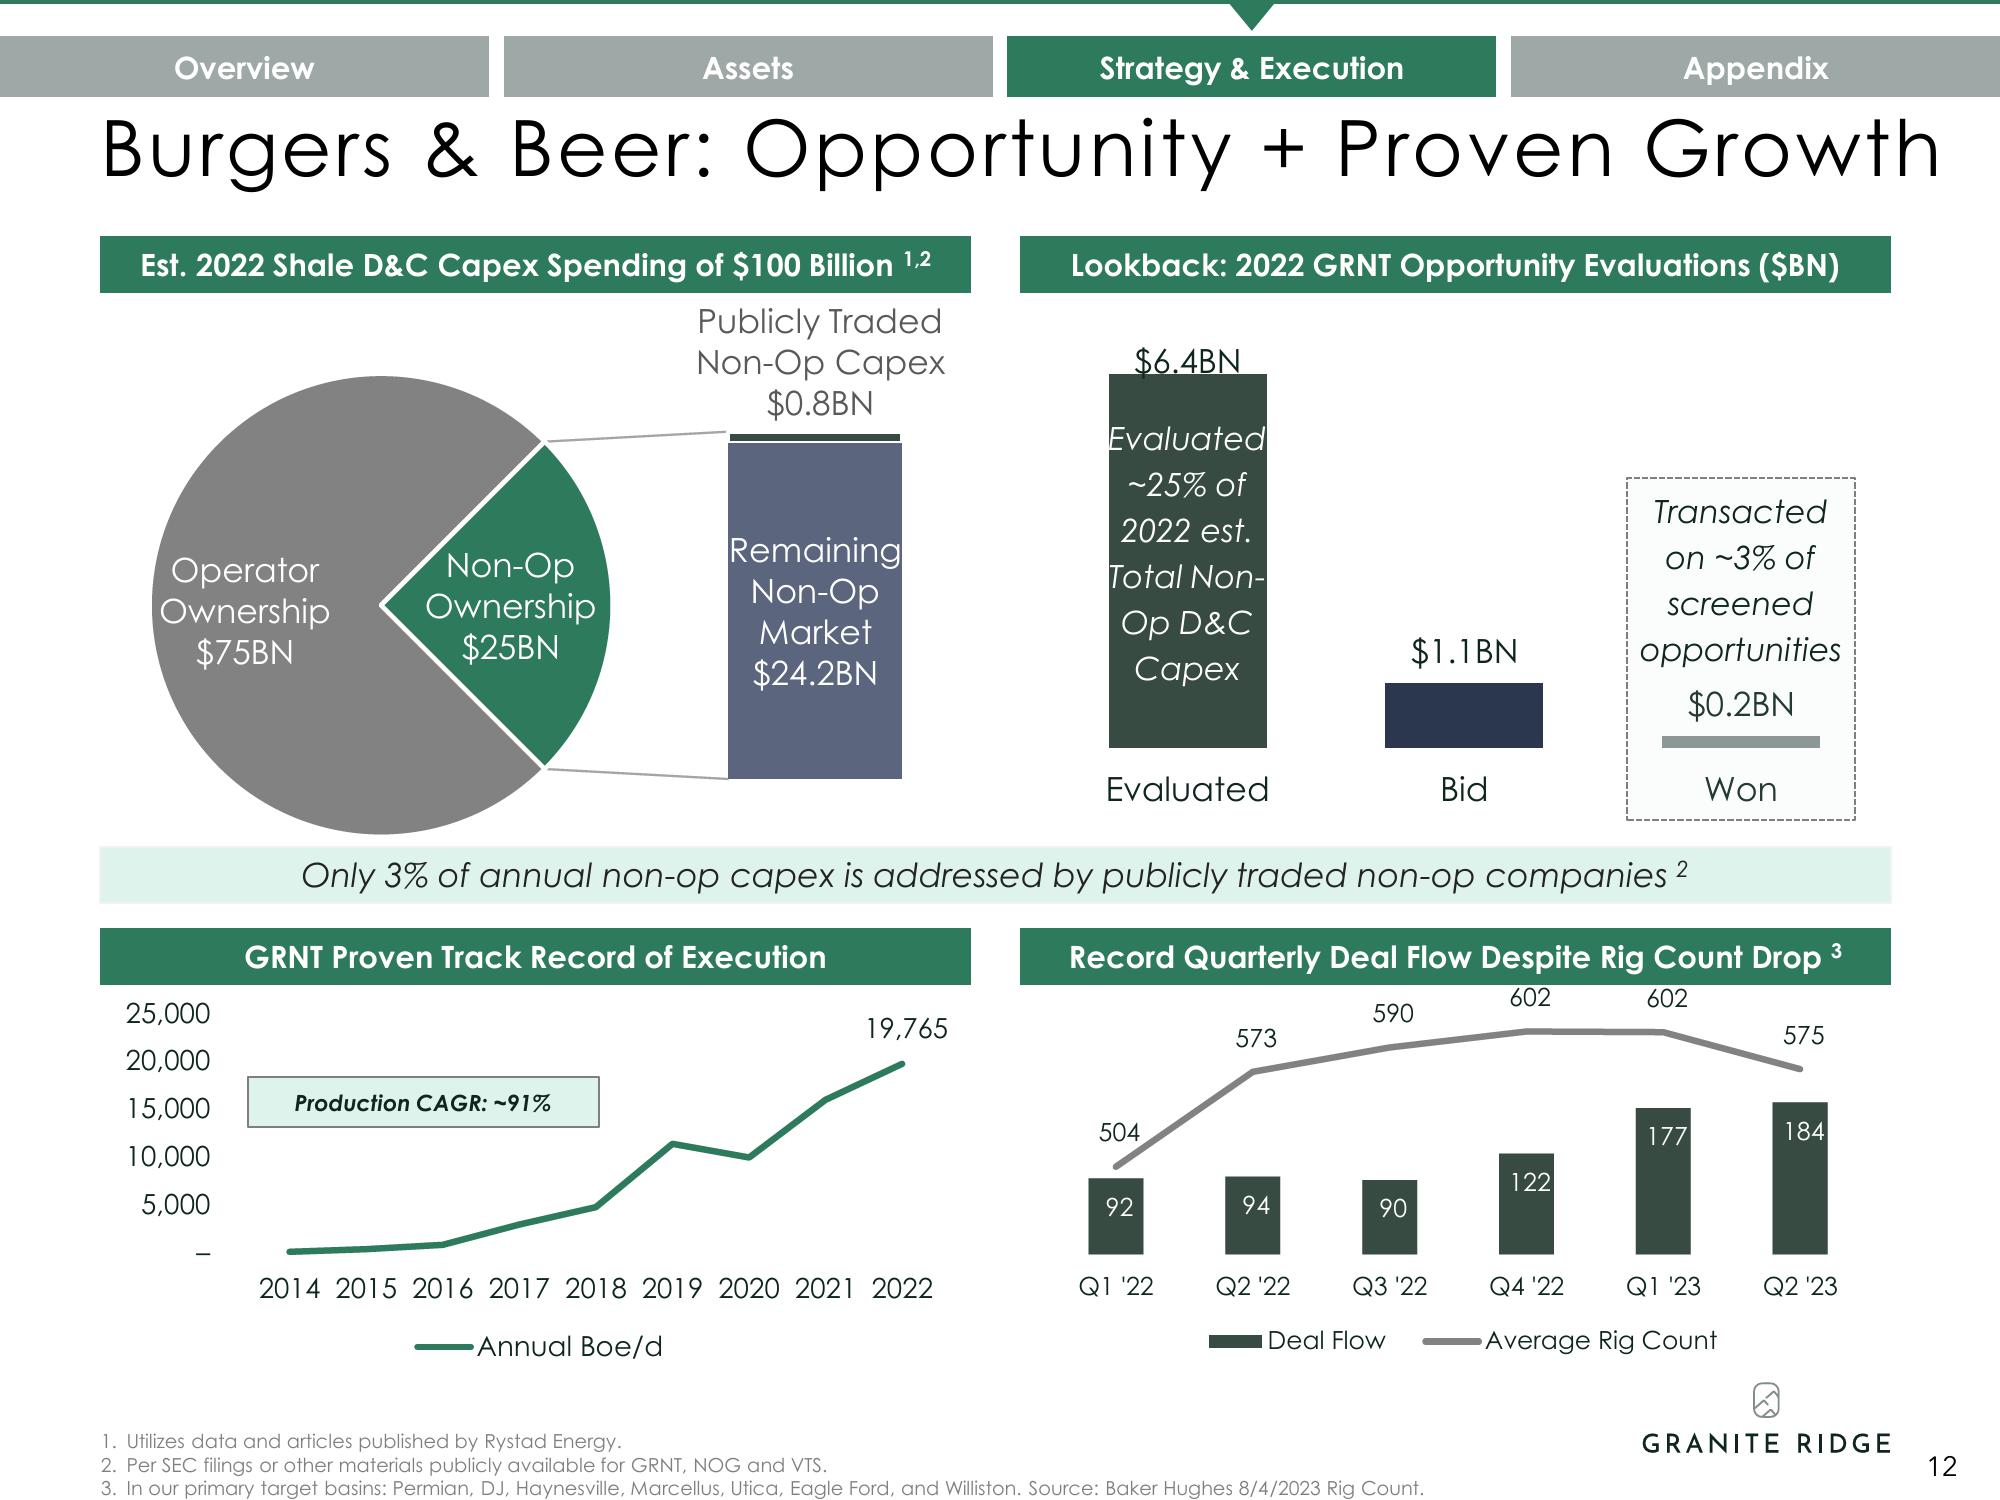
Burgers & Beer: Opportunity + Proven Growth
Lookback: 2022 GRNT Opportunity Evaluations ($BN)
Est. 2022 Shale D&C Capex Spending of $100 Billion ¹,2
Publicly Traded
Non-Op Capex
$0.8BN
Operator
Ownership
$75BN
25,000
20,000
15,000
10,000
5,000
Non-Op
Ownership
$25BN
Assets
Remaining
Non-Op
Market
$24.2BN
Production CAGR: -91%
GRNT Proven Track Record of Execution
19,765
$6.4BN
2014 2015 2016 2017 2018 2019 2020 2021 2022
Annual Boe/d
Evaluated
~25% of
2022 est.
Total Non-
Op D&C
Capex
Evaluated
Only 3% of annual non-op capex is addressed by publicly traded non-op companies 2
3
Record Quarterly Deal Flow Despite Rig Count Drop
602
602
504
92
Q1 '22
573
94
Q2 '22
$1.1BN
590
90
Q3 '22
Deal Flow
Bid
1. Utilizes data and articles published by Rystad Energy.
2. Per SEC filings or other materials publicly available for GRNT, NOG and VTS.
3. In our primary target basins: Permian, DJ, Haynesville, Marcellus, Utica, Eagle Ford, and Williston. Source: Baker Hughes 8/4/2023 Rig Count.
Transacted
on ~3% of
screened
opportunities
$0.2BN
122
Won
177
Q4 '22 Q1 '23
Average Rig Count
575
@
184
Q2 '23
GRANITE RIDGE
12View entire presentation