Netstreit Investor Presentation Deck
1
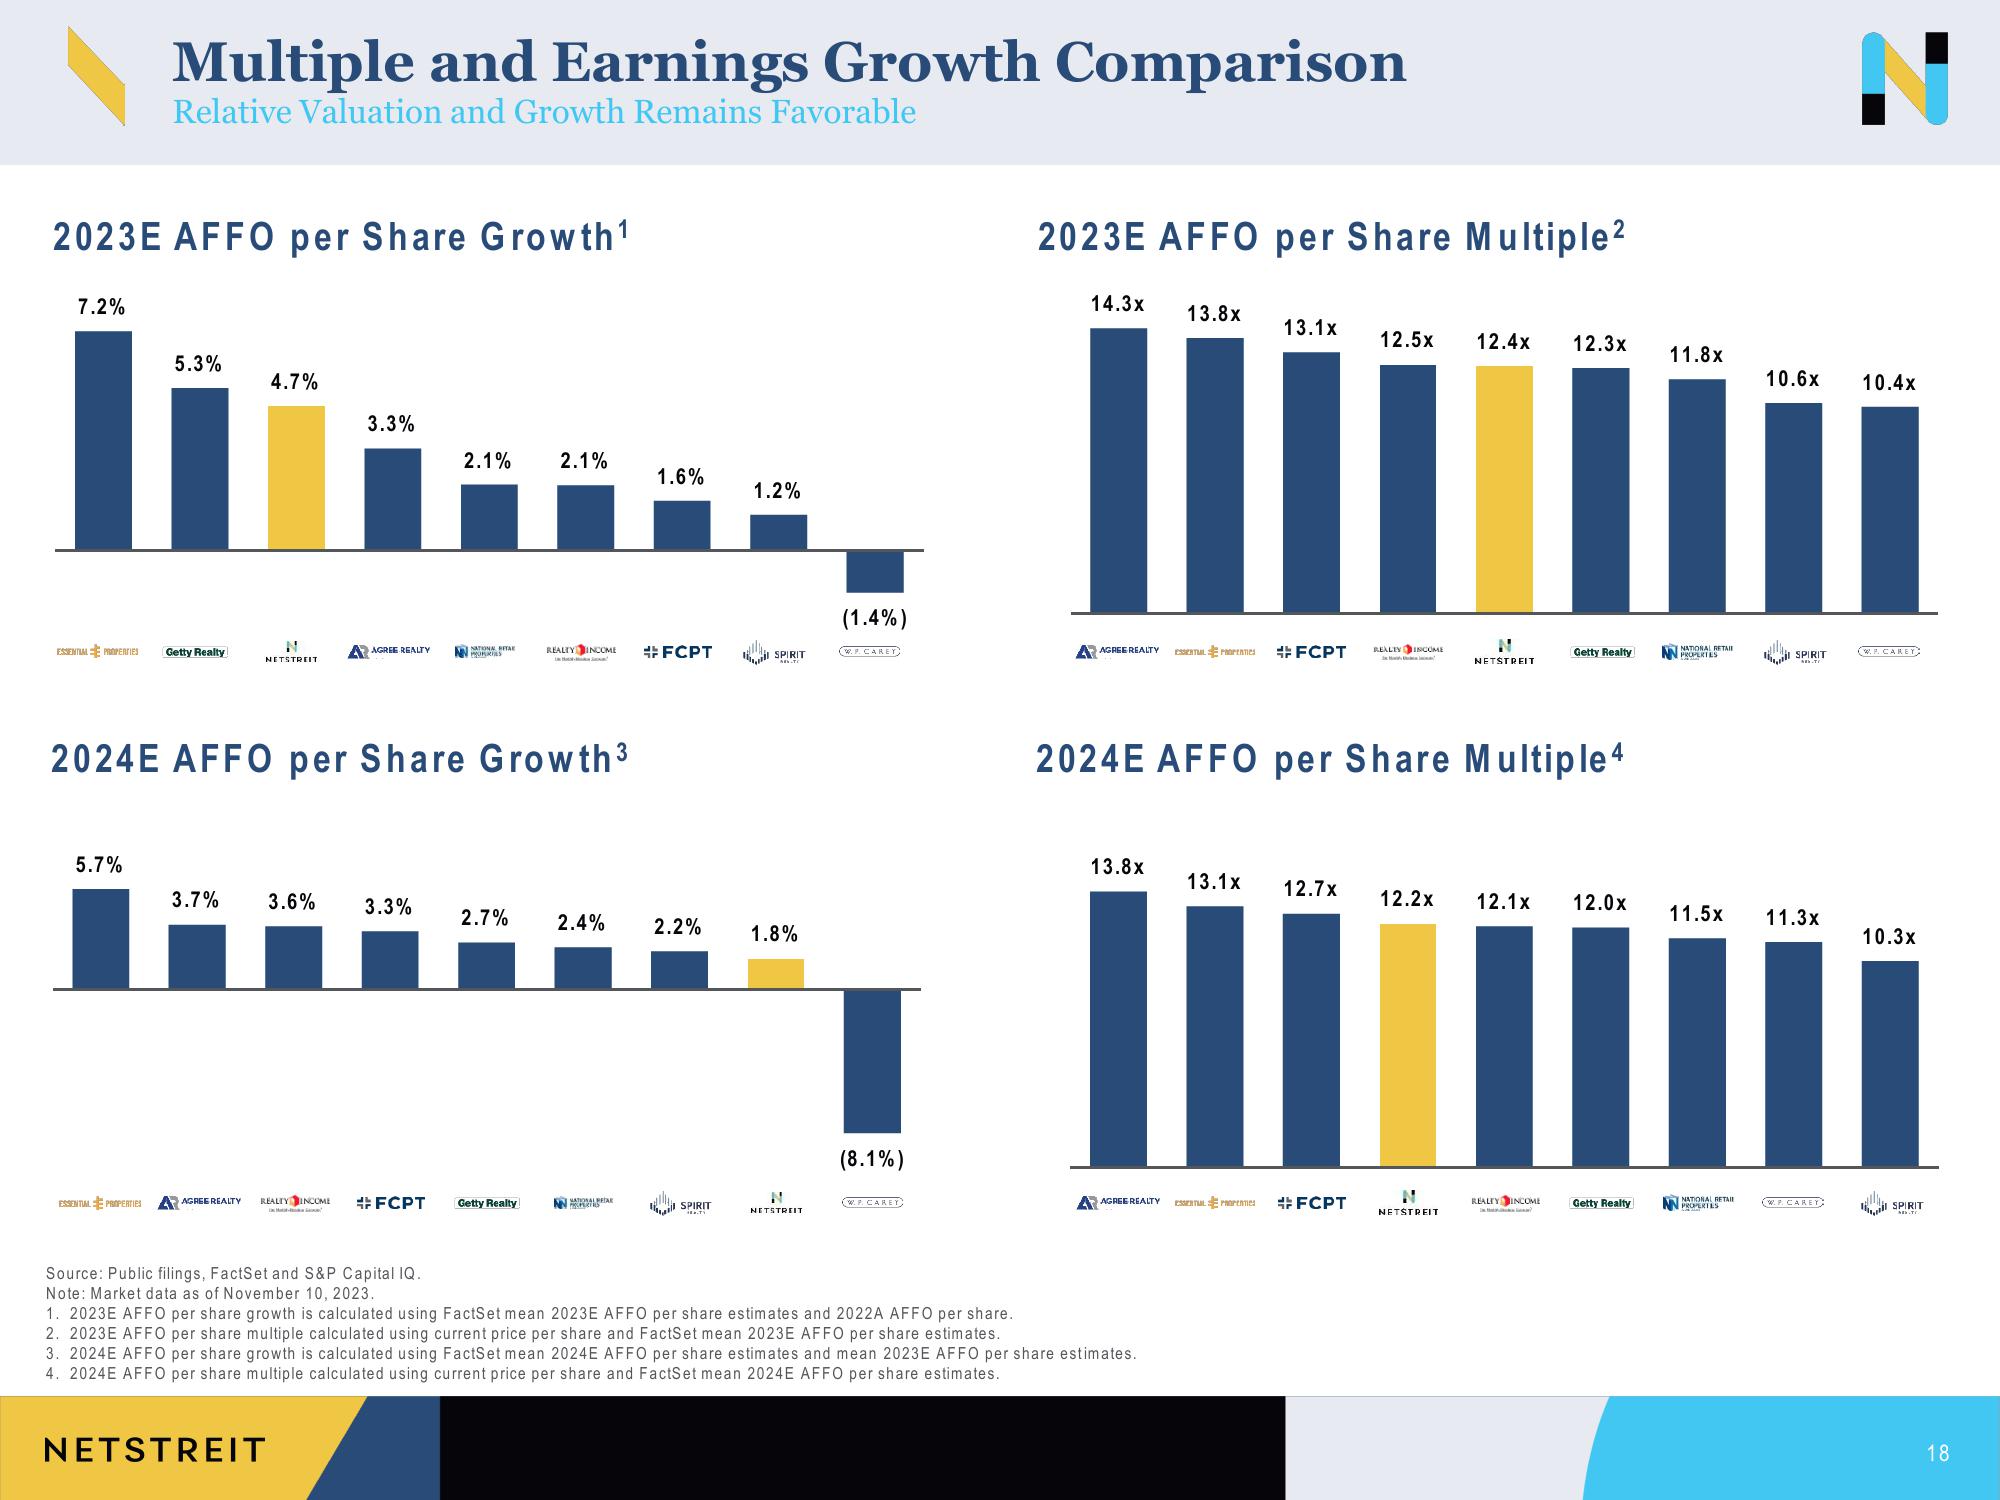
2023E AFFO per Share Growth ¹
7.2%
ESSENTIAL PROPERTIES
Multiple and Earnings Growth Comparison
Relative Valuation and Growth Remains Favorable
5.7%
ESSENTIAL PROPERTIES
5.3%
Getty Realty
4.7%
3.7%
N
NETSTREIT
3.3%
3.6%
AGREE REALTY
3.3%
3
2024E AFFO per Share Growth ³
AGREE REALTY REALTY INCOME #FCPT
2.1%
Source: Public filings, FactSet and S&P Capital IQ.
Note: Market data as of November 10, 2023.
N
MORERES
2.7%
2.1%
Getty Realty
REALTY INCOME
Ha
2.4%
NN PAR
1.6%
#FCPT
2.2%
SPIRIT
1.2%
I SPIRIT
1.8%
NETSTREIT
(1.4%)
(W.P. CAREY)
(8.1%)
(W.P. CAREY
2023E AFFO per Share Multiple ²
14.3x
13.8x
I
AGREE REALTY
13.8x
13.1x
ESSENTUL PROPERTIES #FCPT
1. 2023E AFFO per share growth is calculated using FactSet mean 2023E AFFO per share estimates and 2022A AFFO per share.
2. 2023E AFFO per share multiple calculated using current price per share and FactSet mean 2023E AFFO per share estimates.
3. 2024E AFFO per share growth is calculated using FactSet mean 2024E AFFO per share estimates and mean 2023E AFFO per share estimates.
4. 2024E AFFO per share multiple calculated using current price per share and FactSet mean 2024E AFFO per share estimates.
NETSTREIT
13.1x 12.7x
AGREE REALTY ESSENTIAL PROPERTIES #FCPT
12.5x
REALTY INCOME
2024E AFFO per Share Multiple 4
12.2x
12.4x 12.3x
N
NETSTREIT
NETSTREIT
Getty Realty
12.1x 12.0x
REALTY INCOME
Getty Realty
11.8x
NATIONAL RETAIL
PROPERTES
11.5x
NATIONAL RETAIL
PROPERTES
10.6x
SPIRIT
11.3x
(W.P. CAREY
10.4x
(WE CAREY
10.3x
SPIRIT
18View entire presentation