Waldencast SPAC Presentation Deck
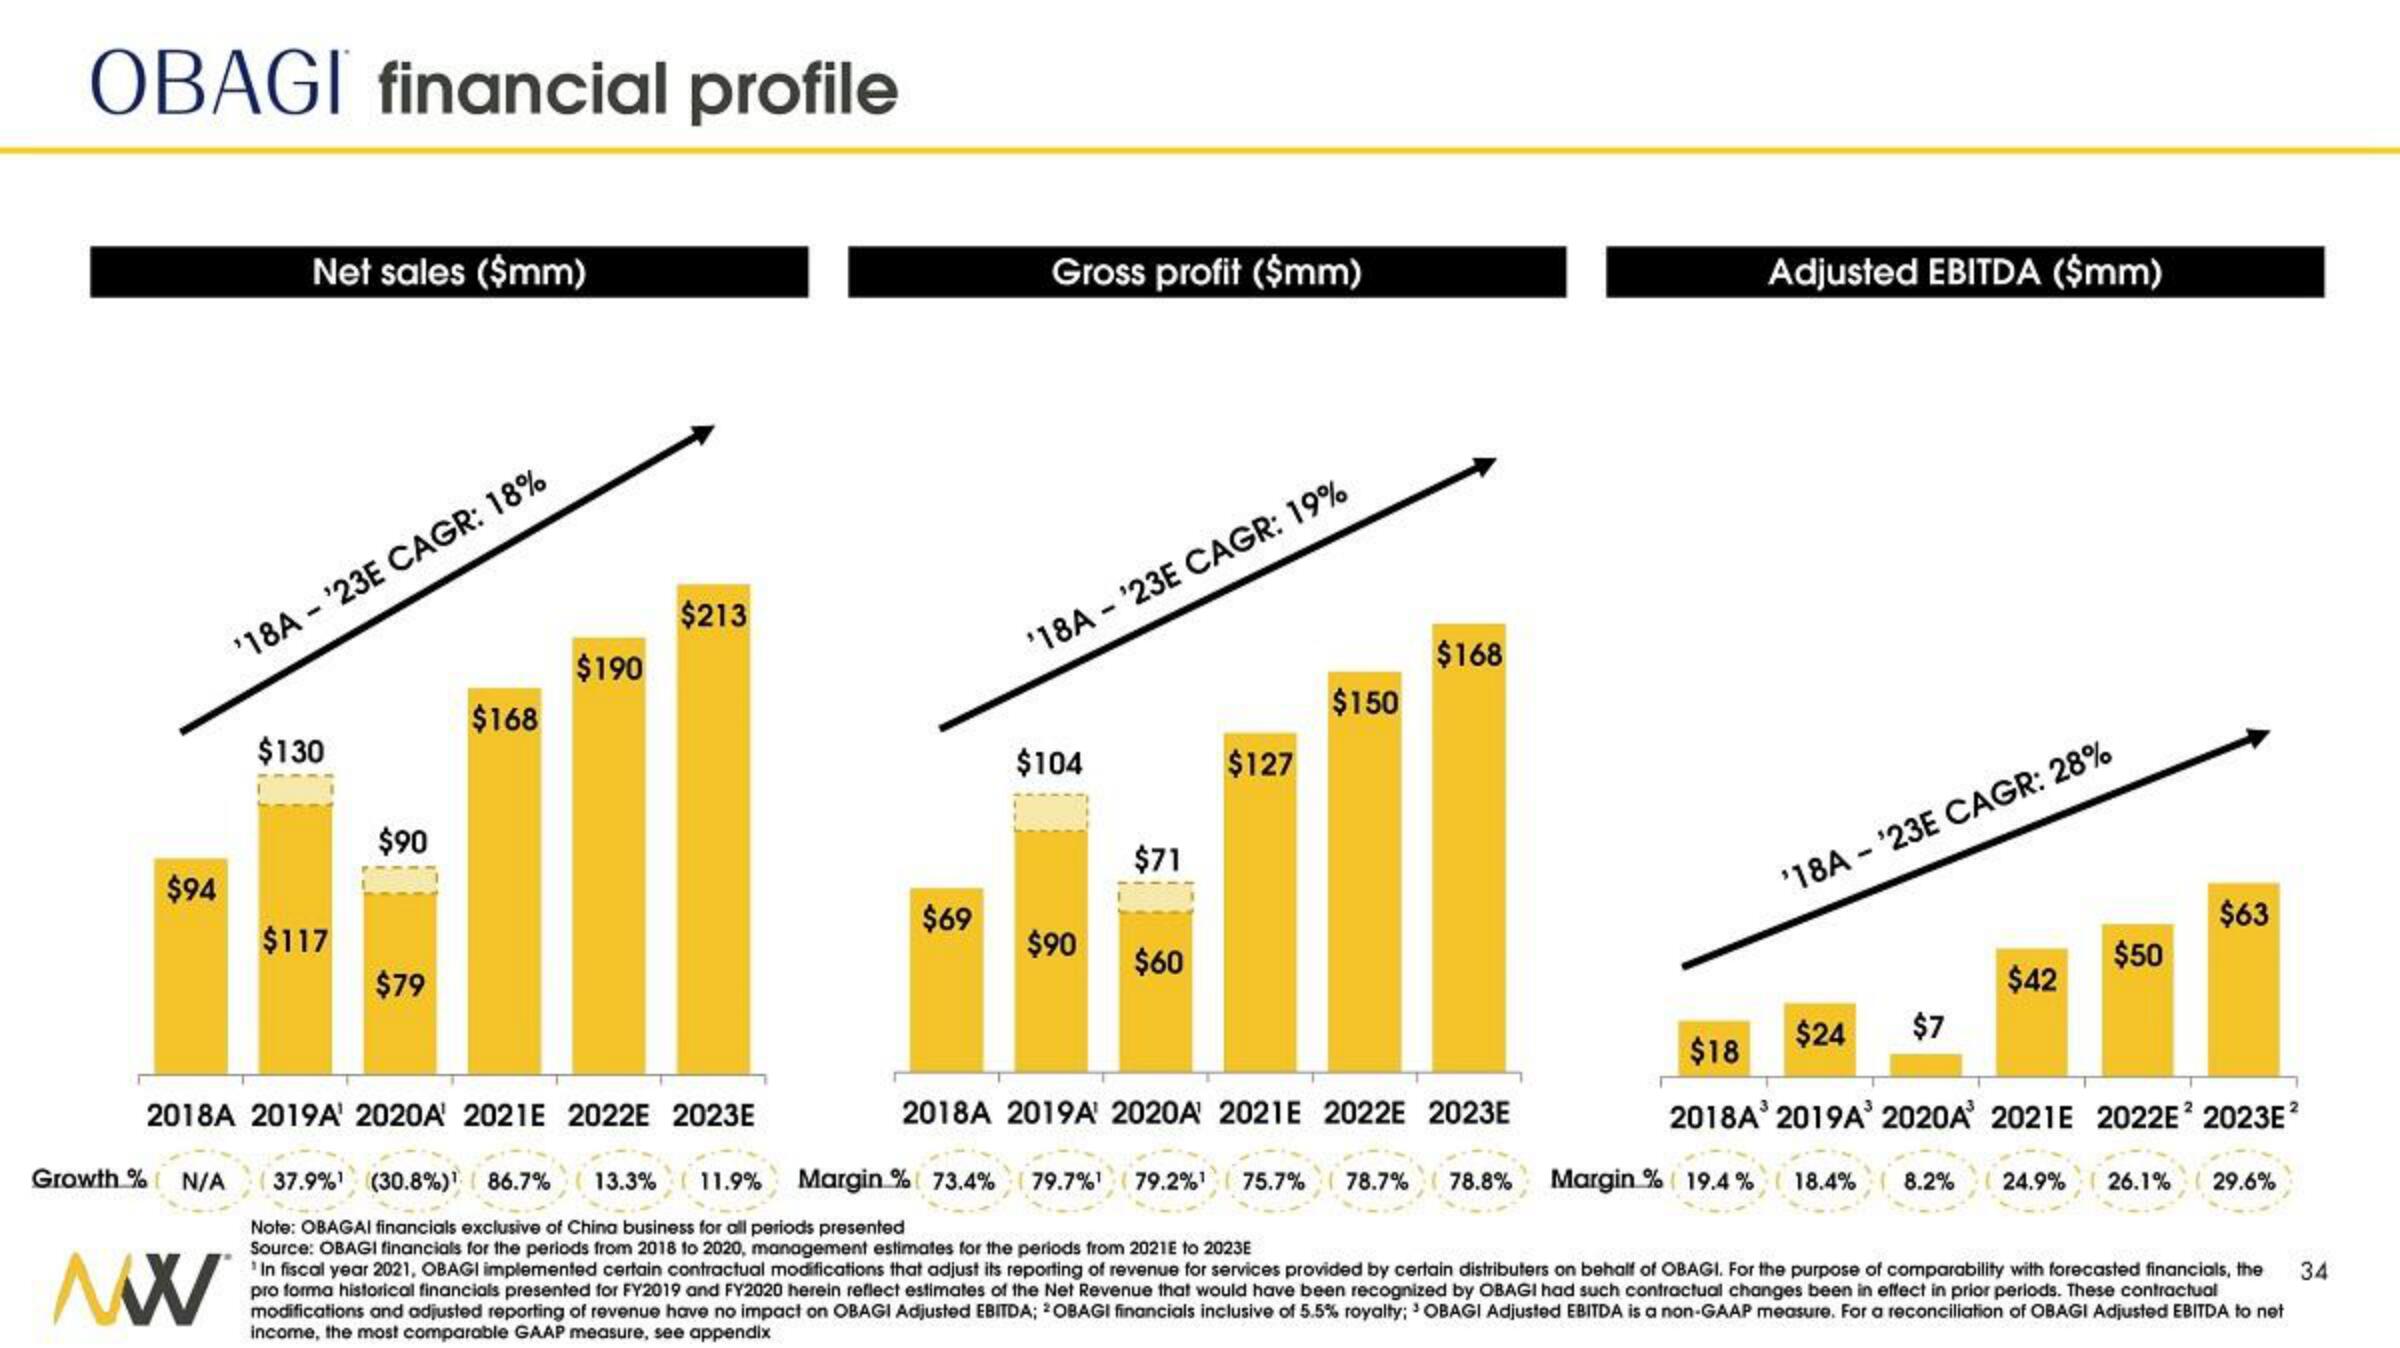
OBAGI financial profile
$94
Growth % N/A
Net sales ($mm)
MW
'18A-'23E CAGR: 18%
$130
$117
$90
$79
$168
$190
$213
2018A 2019A' 2020A' 2021E 2022E 2023E
$69
Gross profit ($mm)
'18A-'23E CAGR: 19%
$104
$90
$71
$60
$127
$150
$168
Adjusted EBITDA ($mm)
'18A-'23E CAGR: 28%
$24
$7
$42
$50
$63
$18
2018A³ 2019A³ 2020A 2021E 2022E² 2023E²
Margin % 19.4% 18.4% 8.2% 24.9% 26.1% 29.6%
2018A 2019A 2020A 2021E 2022E 2023E
37.9%¹ (30.8%) ¹ 86.7% 13.3% 11.9% Margin % 73.4% 79.7%¹ 79.2%¹ 75.7% 78.7% 78.8%
Note: OBAGAI financials exclusive of China business for all periods presented
Source: OBAGI financials for the periods from 2018 to 2020, management estimates for the periods from 2021E to 2023E
'In fiscal year 2021, OBAGI implemented certain contractual modifications that adjust its reporting of revenue for services provided by certain distributers on behalf of OBAGI. For the purpose of comparability with forecasted financials, the
pro forma historical financials presented for FY2019 and FY2020 herein reflect estimates of the Net Revenue that would have been recognized by OBAGI had such contractual changes been in effect in prior periods. These contractual
modifications and adjusted reporting of revenue have no impact on OBAGI Adjusted EBITDA; OBAGI financials inclusive of 5.5% royalty; OBAGI Adjusted EBITDA is a non-GAAP measure. For a reconciliation of OBAGI Adjusted EBITDA to net
income, the most comparable GAAP measure, see appendix
34View entire presentation