Goldman Sachs Investment Banking Pitch Book
Goldman
Sachs
Company
Focus Financial Partners
Brokerage / Wealth
Ameriprise
Raymond James
LPL Financial Holdings
Stifel Financial
Blucora
Median
Discount Brokers
Charles Schwab
Median
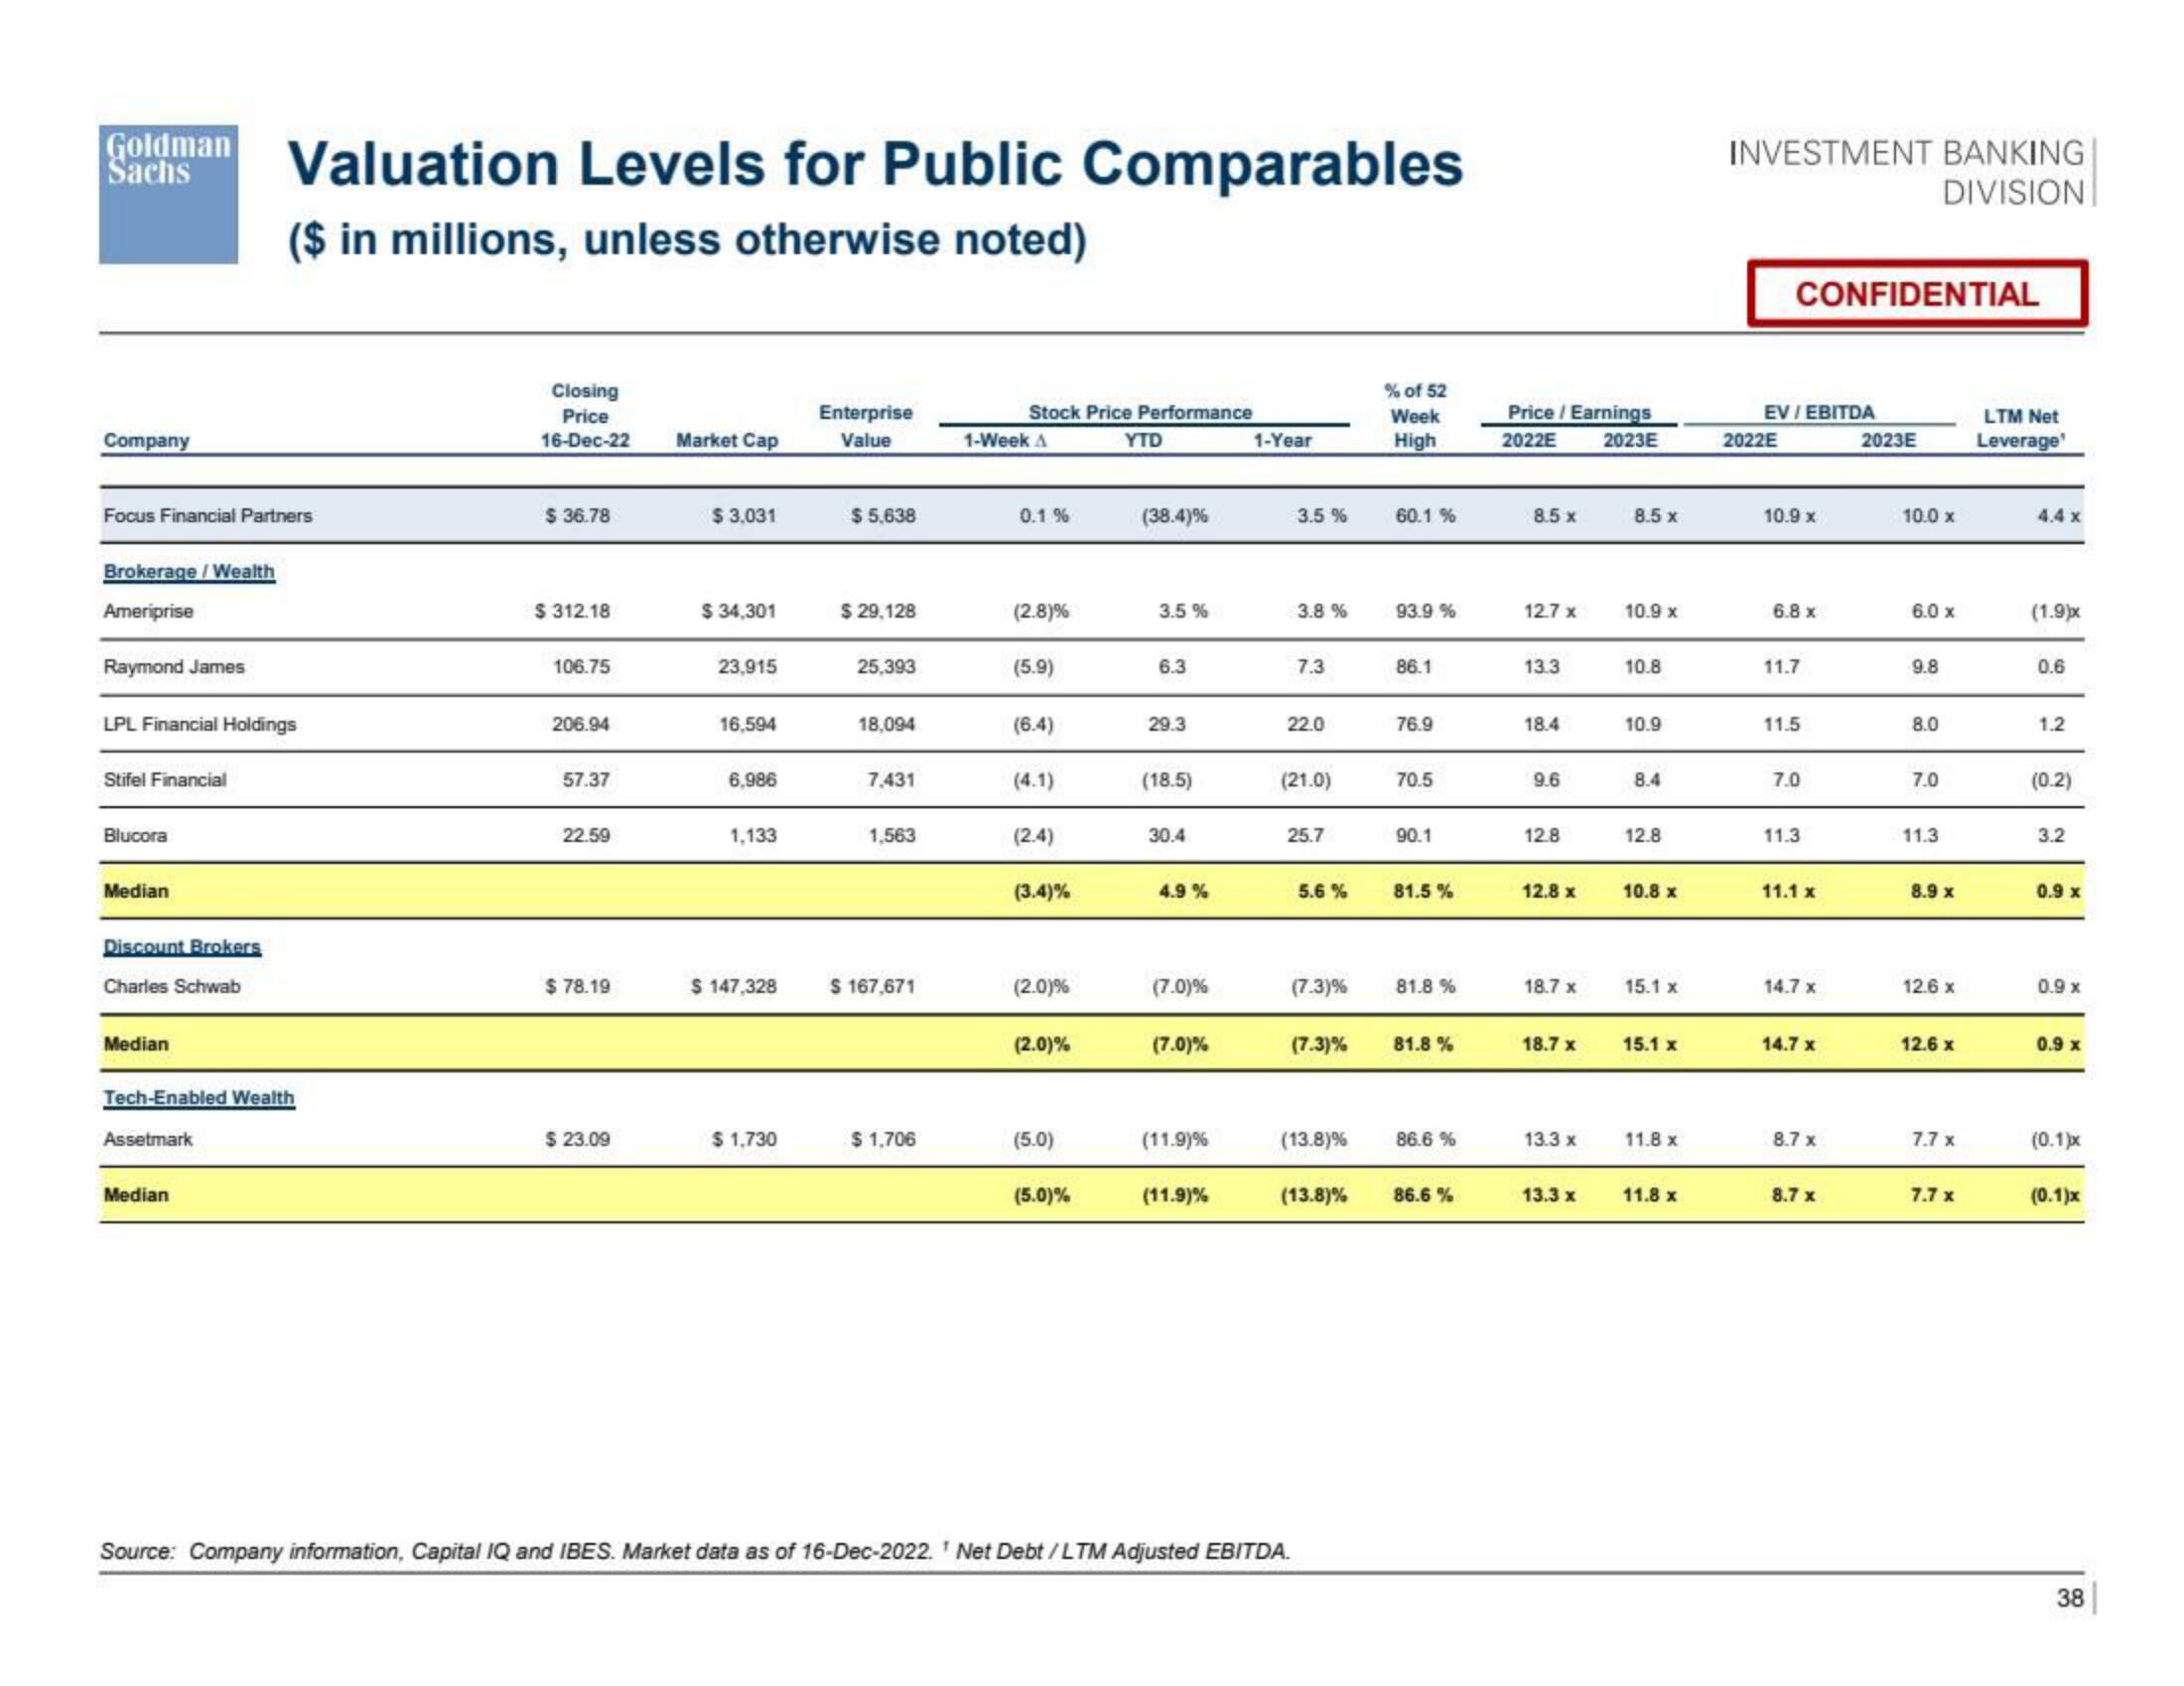
Valuation Levels for Public Comparables
($ in millions, unless otherwise noted)
Tech-Enabled Wealth
Assetmark
Median
Closing
Price
16-Dec-22 Market Cap
$36.78
$ 312.18
106.75
206.94
57.37
22.59
$78.19
$ 23.09
$ 3,031
$ 34,301
23,915
16,594
6,986
1,133
$ 147,328
$1,730
Enterprise
Value
$ 5,638
$ 29,128
25,393
18,094
7,431
1,563
$ 167,671
$ 1,706
Stock Price Performance
1-Week A
YTD
0.1%
(2.8)%
(5.9)
(6.4)
(4.1)
(2.4)
(3.4)%
(2.0)%
(2.0)%
(5.0)
(5.0)%
(38.4)%
3.5%
6.3
29.3
(18.5)
30.4
4.9%
(7.0)%
(7.0)%
(11.9)%
(11.9)%
1-Year
3.5 %
3.8 %
7.3
22.0
(21.0)
25.7
5.6 %
(7.3)%
Source: Company information, Capital IQ and IBES. Market data as of 16-Dec-2022.¹ Net Debt/LTM Adjusted EBITDA.
(7.3)%
(13.8)%
% of 52
Week
High
60.1 %
93.9 %
86.1
76.9
70.5
90.1
81.5%
81.8%
(13.8)% 86.6%
81.8%
86.6%
Price / Earnings
2022E 2023E
8.5 x
12.7 x
13.3
18.4
9.6
12.8
12.8 x
18.7 x
18.7 x
13.3 x
13.3 x
8.5 x
10.9 x
10.8
10.9
8.4
12.8
10.8 x
15.1 x
15.1 x
11.8 x
11.8 x
INVESTMENT BANKING
DIVISION
CONFIDENTIAL
EV/EBITDA
2022E
10.9 x
6.8 x
11.7
11.5
7.0
11.3
11.1 x
14.7 x
14.7 x
8.7 x
8.7 x
2023E
10.0 x
6.0 x
9.8
8.0
7.0
11.3
8.9 x
12.6 x
12.6 x
7.7 x
7.7 x
LTM Net
Leverage¹
4.4 x
(1.9)x
0.6
1.2
(0.2)
3.2
0.9 x
0.9 x
0.9 x
(0.1)x
(0.1)x
38View entire presentation