Q4 & Fiscal Year 2023 Financial Results
Overview of Key Metrics
Fiscal year
Sonos households (M)
New HHs
Products registered (M)
Change in registrations
Products/households
Increase
Registrations to existing households
Products sold (K)
Revenue per product sold
Households with 1 product
Products per >1 household
2018
7.4
21.0
2.82
36%
5,165
$220
38%
3.94
2019
9.1
1.7
26.1
5.1
2.87
0.04
36%
6,204
$203
38%
4.01
2020
10.9
1.8
31.6
5.5
2.90
0.03
41%
5,806
$228
39%
4.11
2021
12.6
1.7
37.1
5.5
2.95
0.05
46%
6,503
$264
40%
4.25
2022
14.0
1.4
41.8
4.7
2.98
0.03
44%
6,281
$279
40%
4.30
2023
15.3
1.3
46.6
4.8
3.05
0.06
44%
5,725
$289
40%
4.41
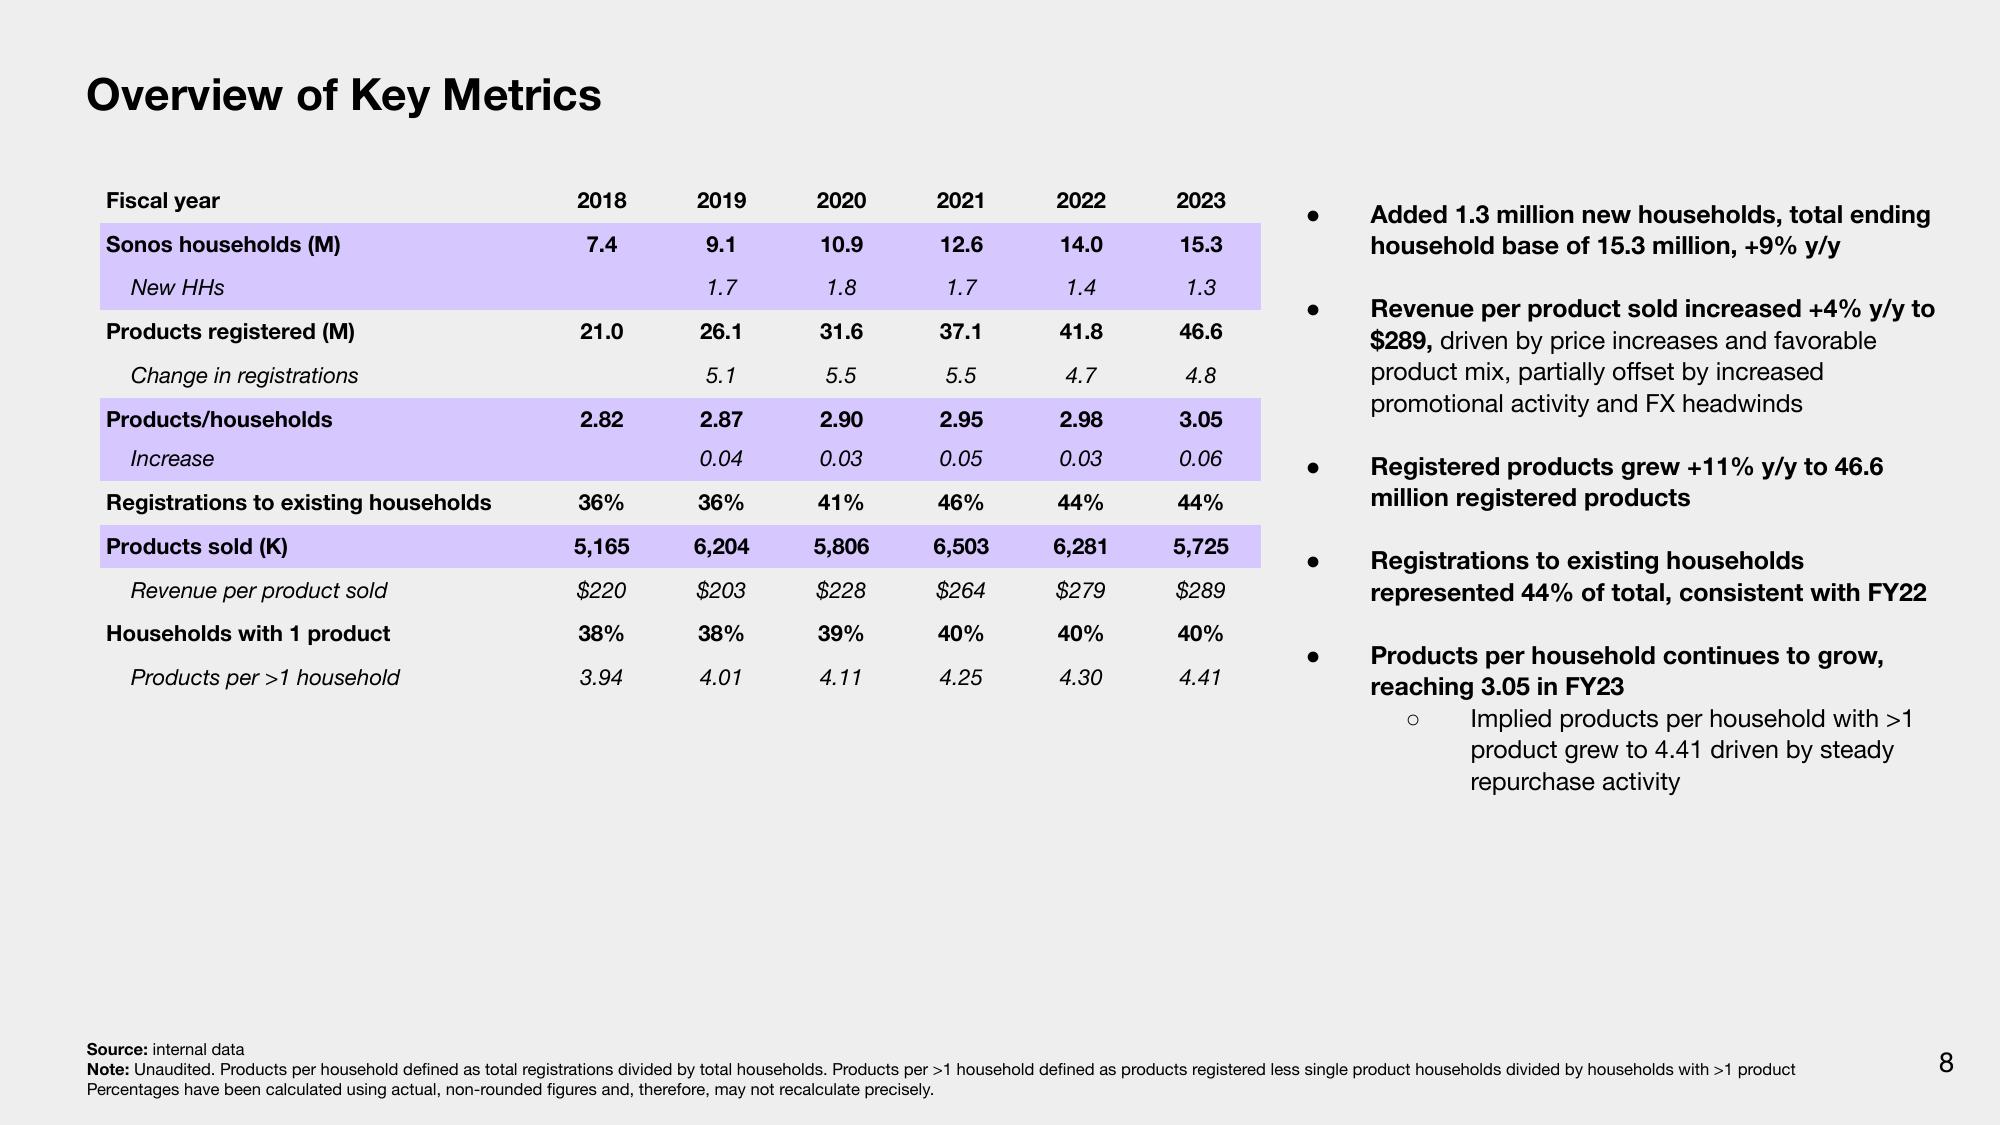
Added 1.3 million new households, total ending
household base of 15.3 million, +9% y/y
Revenue per product sold increased +4% y/y to
$289, driven by price increases and favorable
product mix, partially offset by increased
promotional activity and FX headwinds
Registered products grew +11% y/y to 46.6
million registered products
● Registrations to existing households
represented 44% of total, consistent with FY22
● Products per household continues to grow,
reaching 3.05 in FY23
O
Implied products per household with >1
product grew to 4.41 driven by steady
repurchase activity
Source: internal data
Note: Unaudited. Products per household defined as total registrations divided by total households. Products per >1 household defined as products registered less single product households divided by households with >1 product
Percentages have been calculated using actual, non-rounded figures and, therefore, may not recalculate precisely.
8View entire presentation