Liberty Global Results Presentation Deck
CAPITAL ALLOCATION: STRONG LIQUIDITY PROFILE
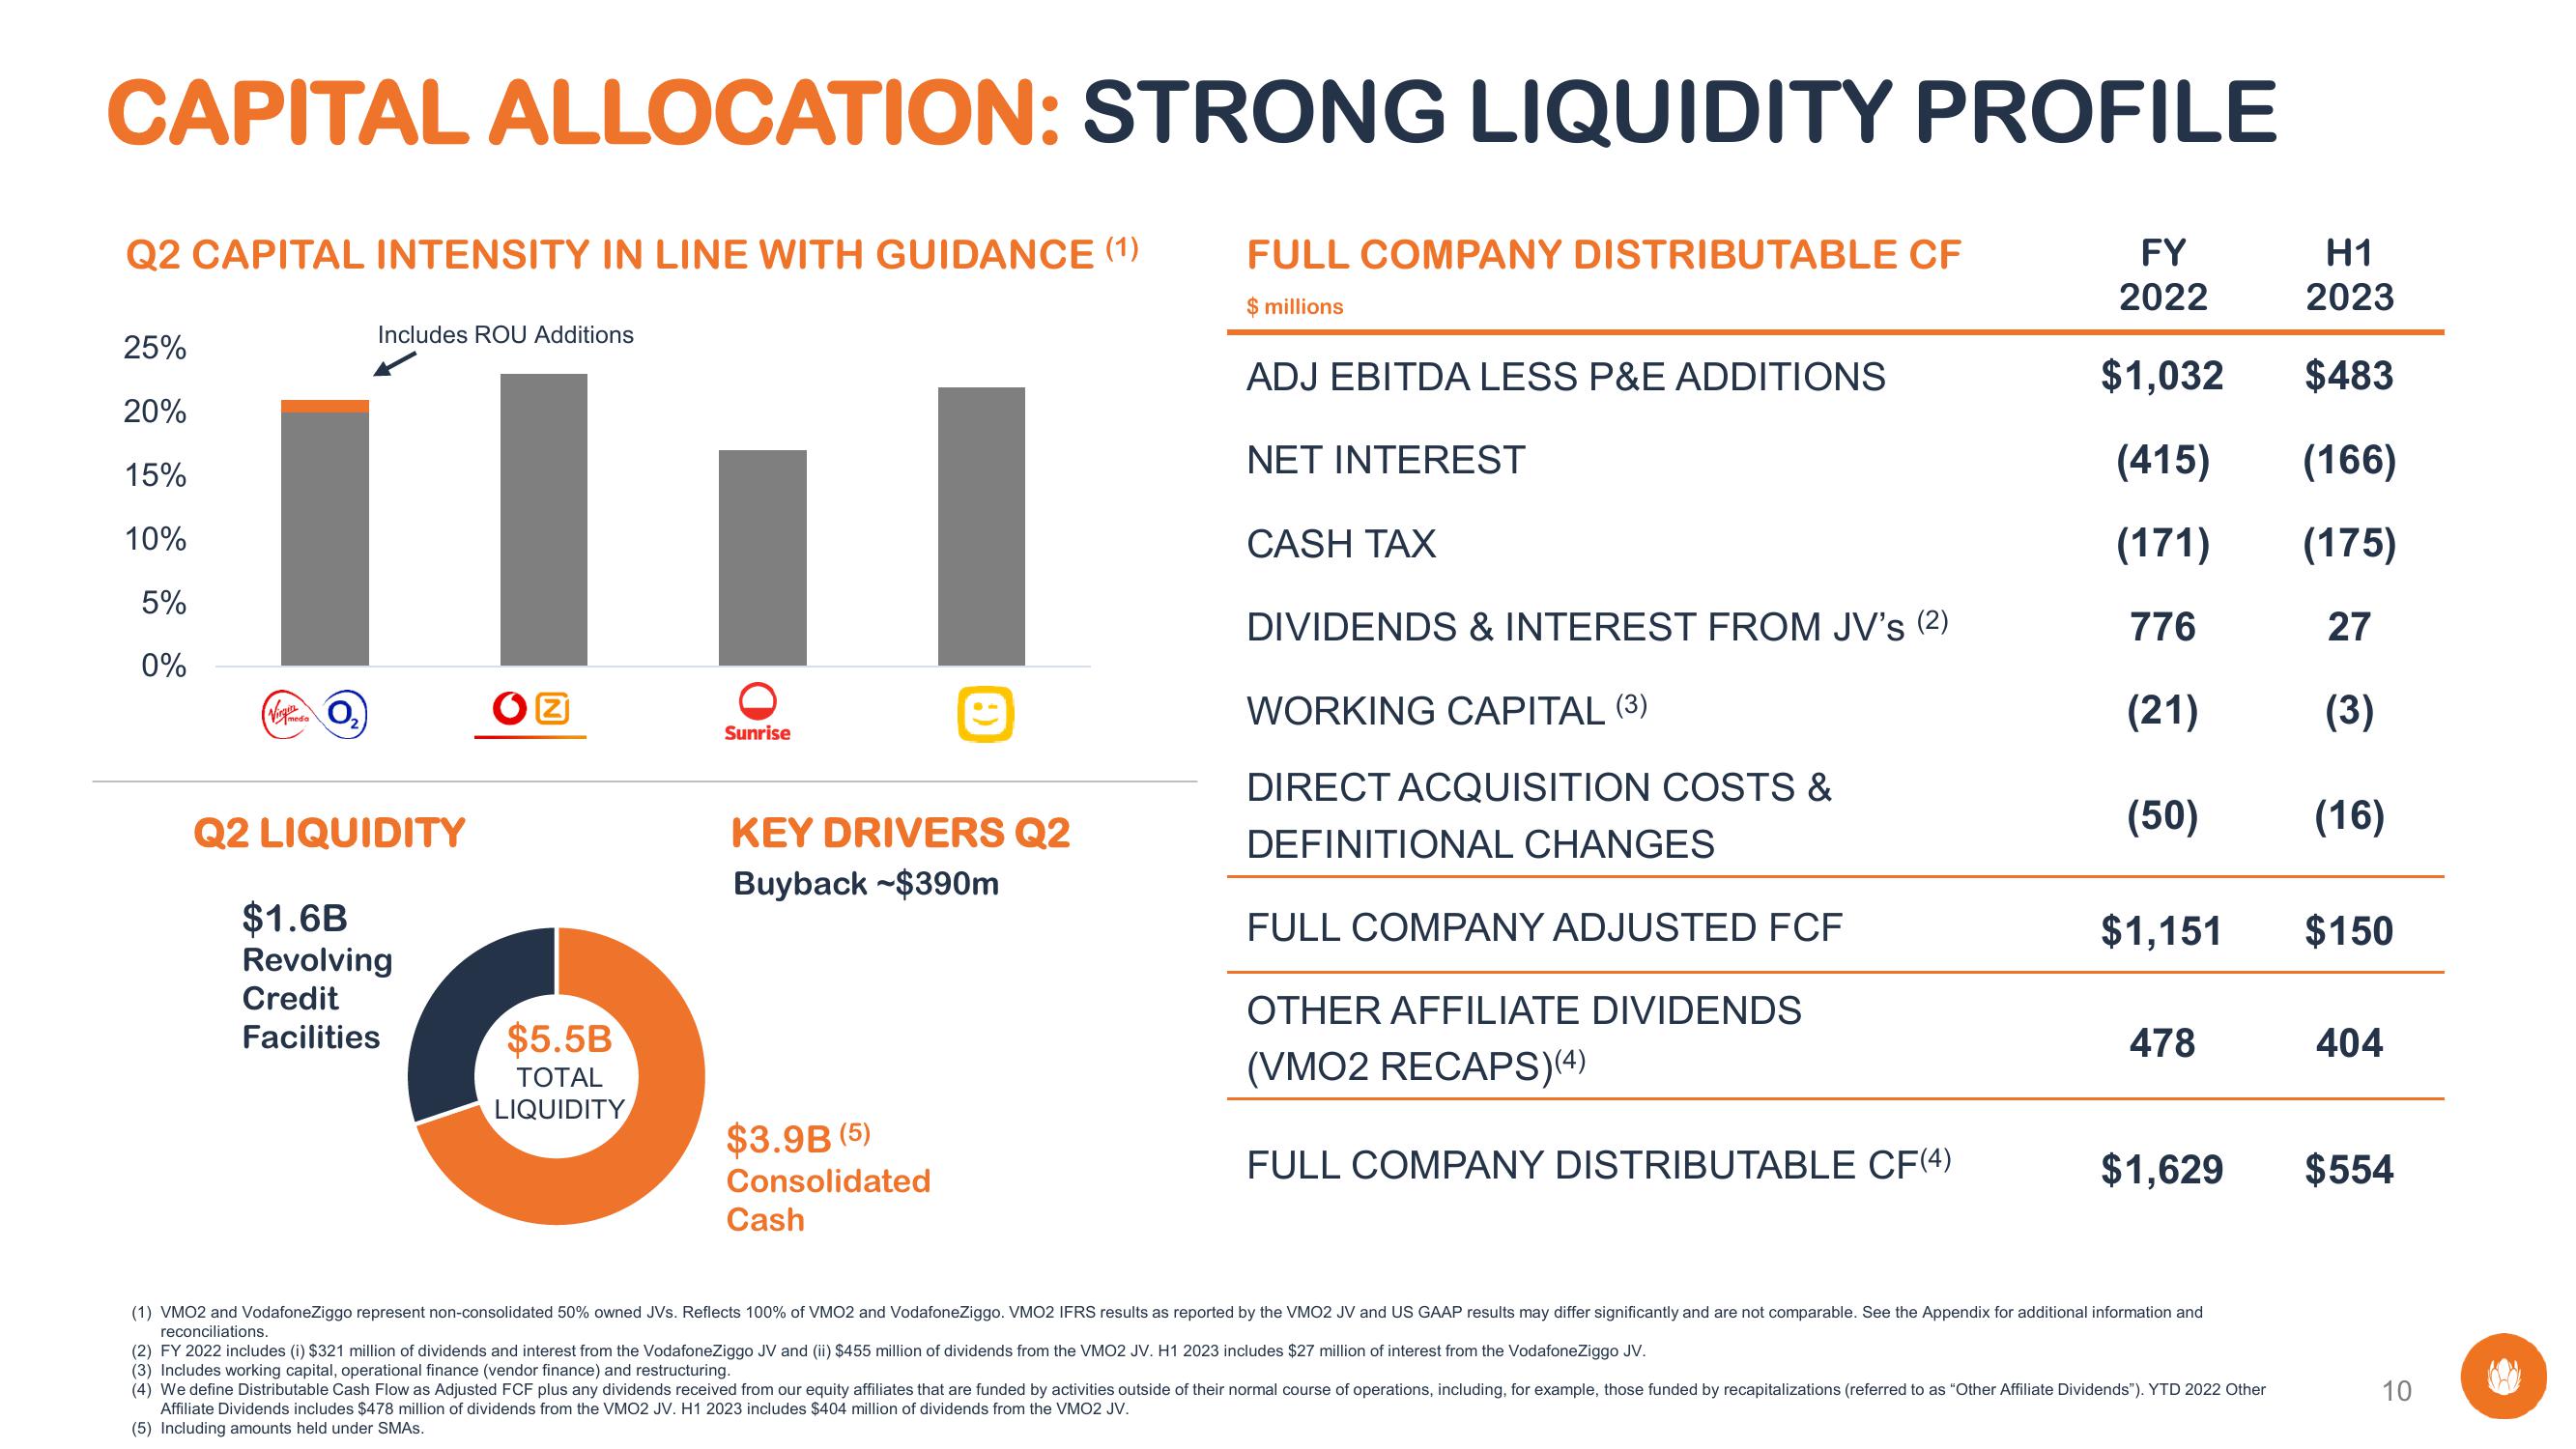
Q2 CAPITAL INTENSITY IN LINE WITH GUIDANCE (1)
25%
20%
15%
10%
5%
0%
(Vido O₂)
Includes ROU Additions
I
OZ
Q2 LIQUIDITY
$1.6B
Revolving
Credit
Facilities
$5.5B
TOTAL
LIQUIDITY
Sunrise
KEY DRIVERS Q2
Buyback-$390m
$3.9B (5)
Consolidated
Cash
FULL COMPANY DISTRIBUTABLE CF
$ millions
ADJ EBITDA LESS P&E ADDITIONS
NET INTEREST
CASH TAX
DIVIDENDS & INTEREST FROM JV's (2)
WORKING CAPITAL (3)
DIRECT ACQUISITION COSTS &
DEFINITIONAL CHANGES
FULL COMPANY ADJUSTED FCF
OTHER AFFILIATE DIVIDENDS
(VMO2 RECAPS)(4)
FULL COMPANY DISTRIBUTABLE CF(4)
FY
2022
$1,032
(415)
(171)
776
(21)
(50)
$1,151
478
$1,629
(1) VMO2 and VodafoneZiggo represent non-consolidated 50% owned JVs. Reflects 100% of VMO2 and VodafoneZiggo. VMO2 IFRS results as reported by the VMO2 JV and US GAAP results may differ significantly and are not comparable. See the Appendix for additional information and
reconciliations.
(2) FY 2022 includes (i) $321 million of dividends and interest from the VodafoneZiggo JV and (ii) $455 million of dividends from the VMO2 JV. H1 2023 includes $27 million of interest from the VodafoneZiggo JV.
(3) Includes working capital, operational finance (vendor finance) and restructuring.
(4) We define Distributable Cash Flow as Adjusted FCF plus any dividends received from our equity affiliates that are funded by activities outside of their normal course of operations, including, for example, those funded by recapitalizations (referred to as "Other Affiliate Dividends"). YTD 2022 Other
Affiliate Dividends includes $478 million of dividends from the VMO2 JV. H1 2023 includes $404 million of dividends from the VMO2 JV.
(5) Including amounts held under SMAS.
H1
2023
$483
(166)
(175)
27
(3)
(16)
$150
404
$554
10View entire presentation