Sonos Results Presentation Deck
Significant Cash Flow and Strong Balance Sheet
Cash flow from operations
Capital expenditures
% of revenue
Free cash flow
Free Cash Flow / Adj EBITDA
Ending cash & cash equivalents
Long-term debt
1Q21
$214.5
$11.3
1.8%
$203.2
122%
$678.0
$0
1Q20
$118.8
$15.9
2.8%
$102.9
110%
$408.6
$23.2
Y/Y
Change
81%
-29%
97%
66%
NM
●
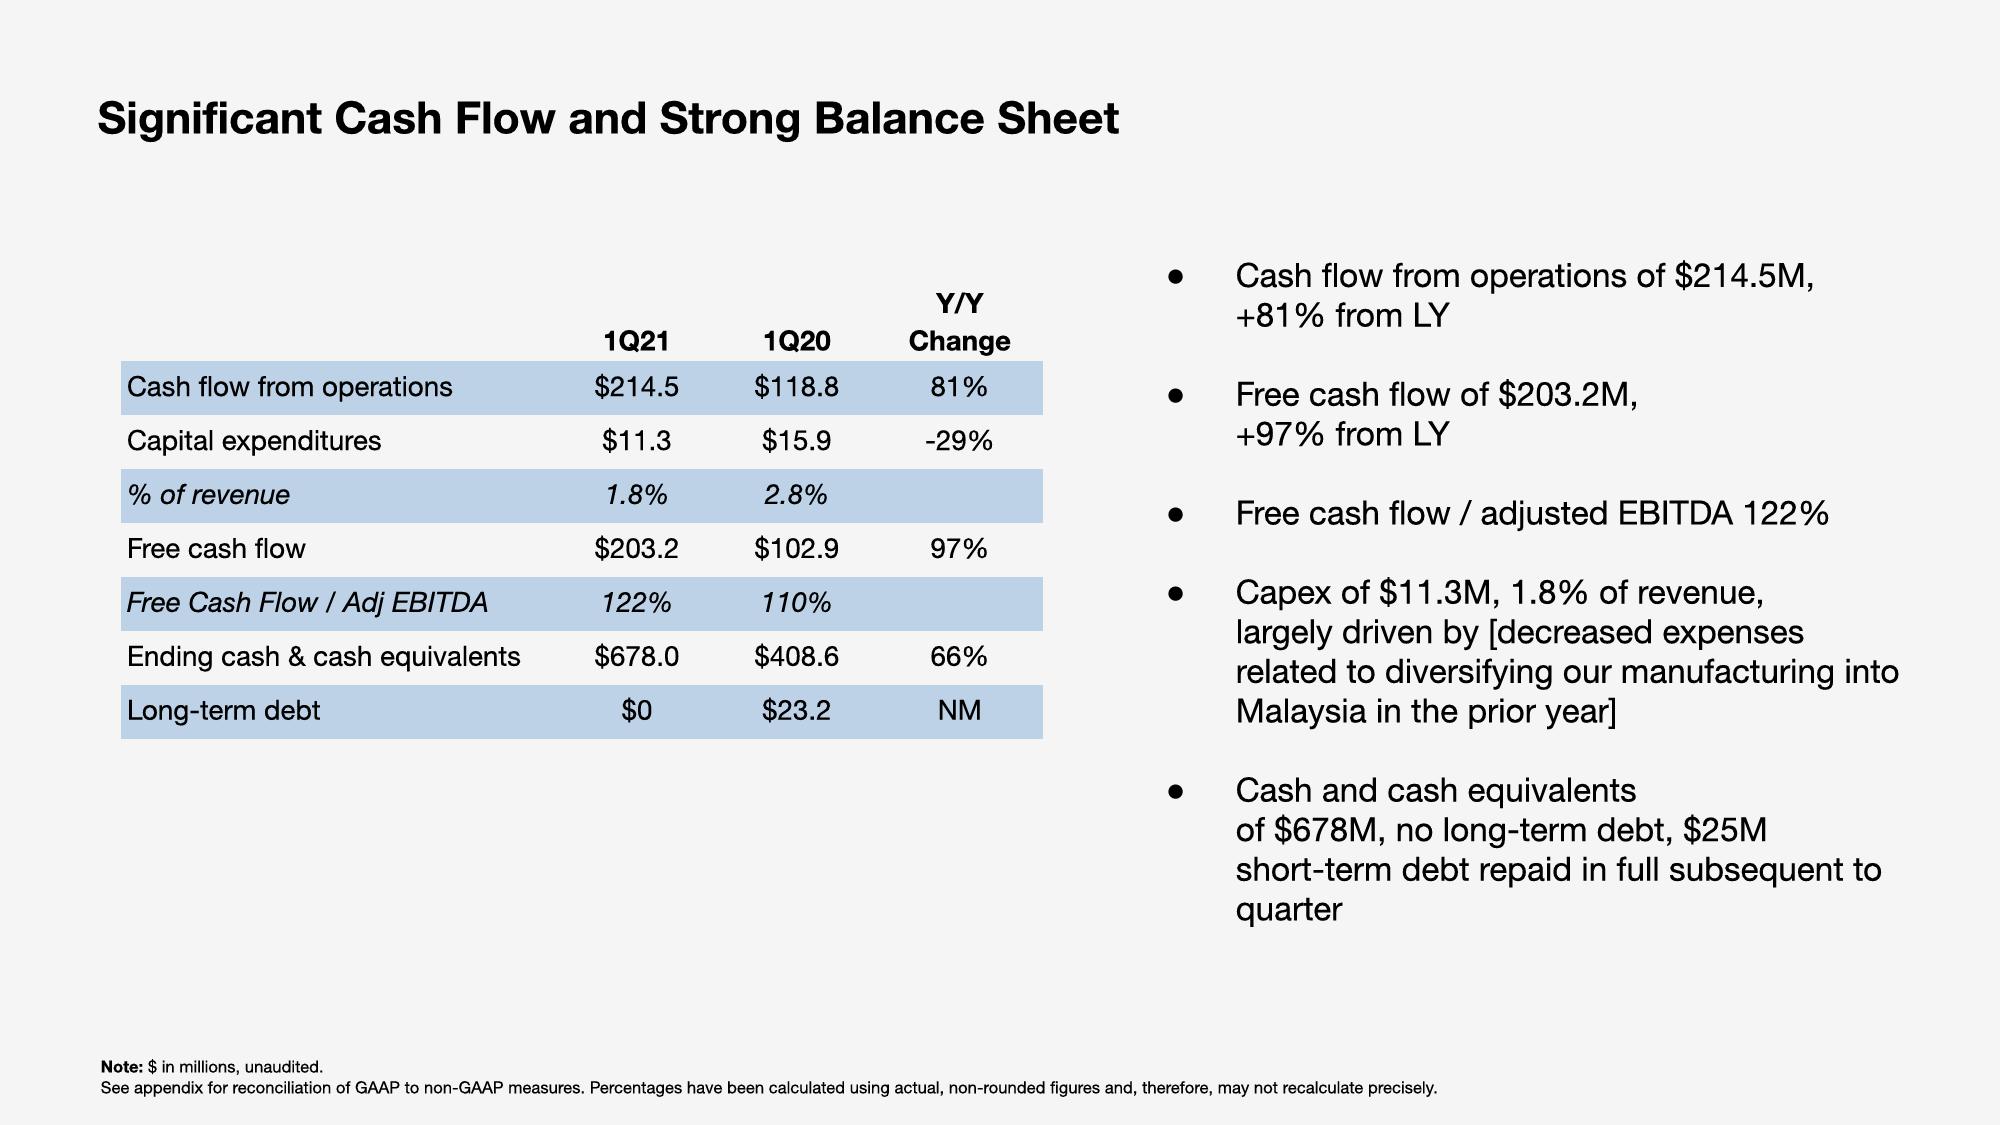
Cash flow from operations of $214.5M,
+81% from LY
Free cash flow of $203.2M,
+97% from LY
Free cash flow / adjusted EBITDA 122%
Capex of $11.3M, 1.8% of revenue,
largely driven by [decreased expenses
related to diversifying our manufacturing into
Malaysia in the prior year]
Cash and cash equivalents
of $678M, no long-term debt, $25M
short-term debt repaid in full subsequent to
quarter
Note: $ in millions, unaudited.
See appendix for reconciliation of GAAP to non-GAAP measures. Percentages have been calculated using actual, non-rounded figures and, therefore, may not recalculate precisely.View entire presentation