Wix Results Presentation Deck
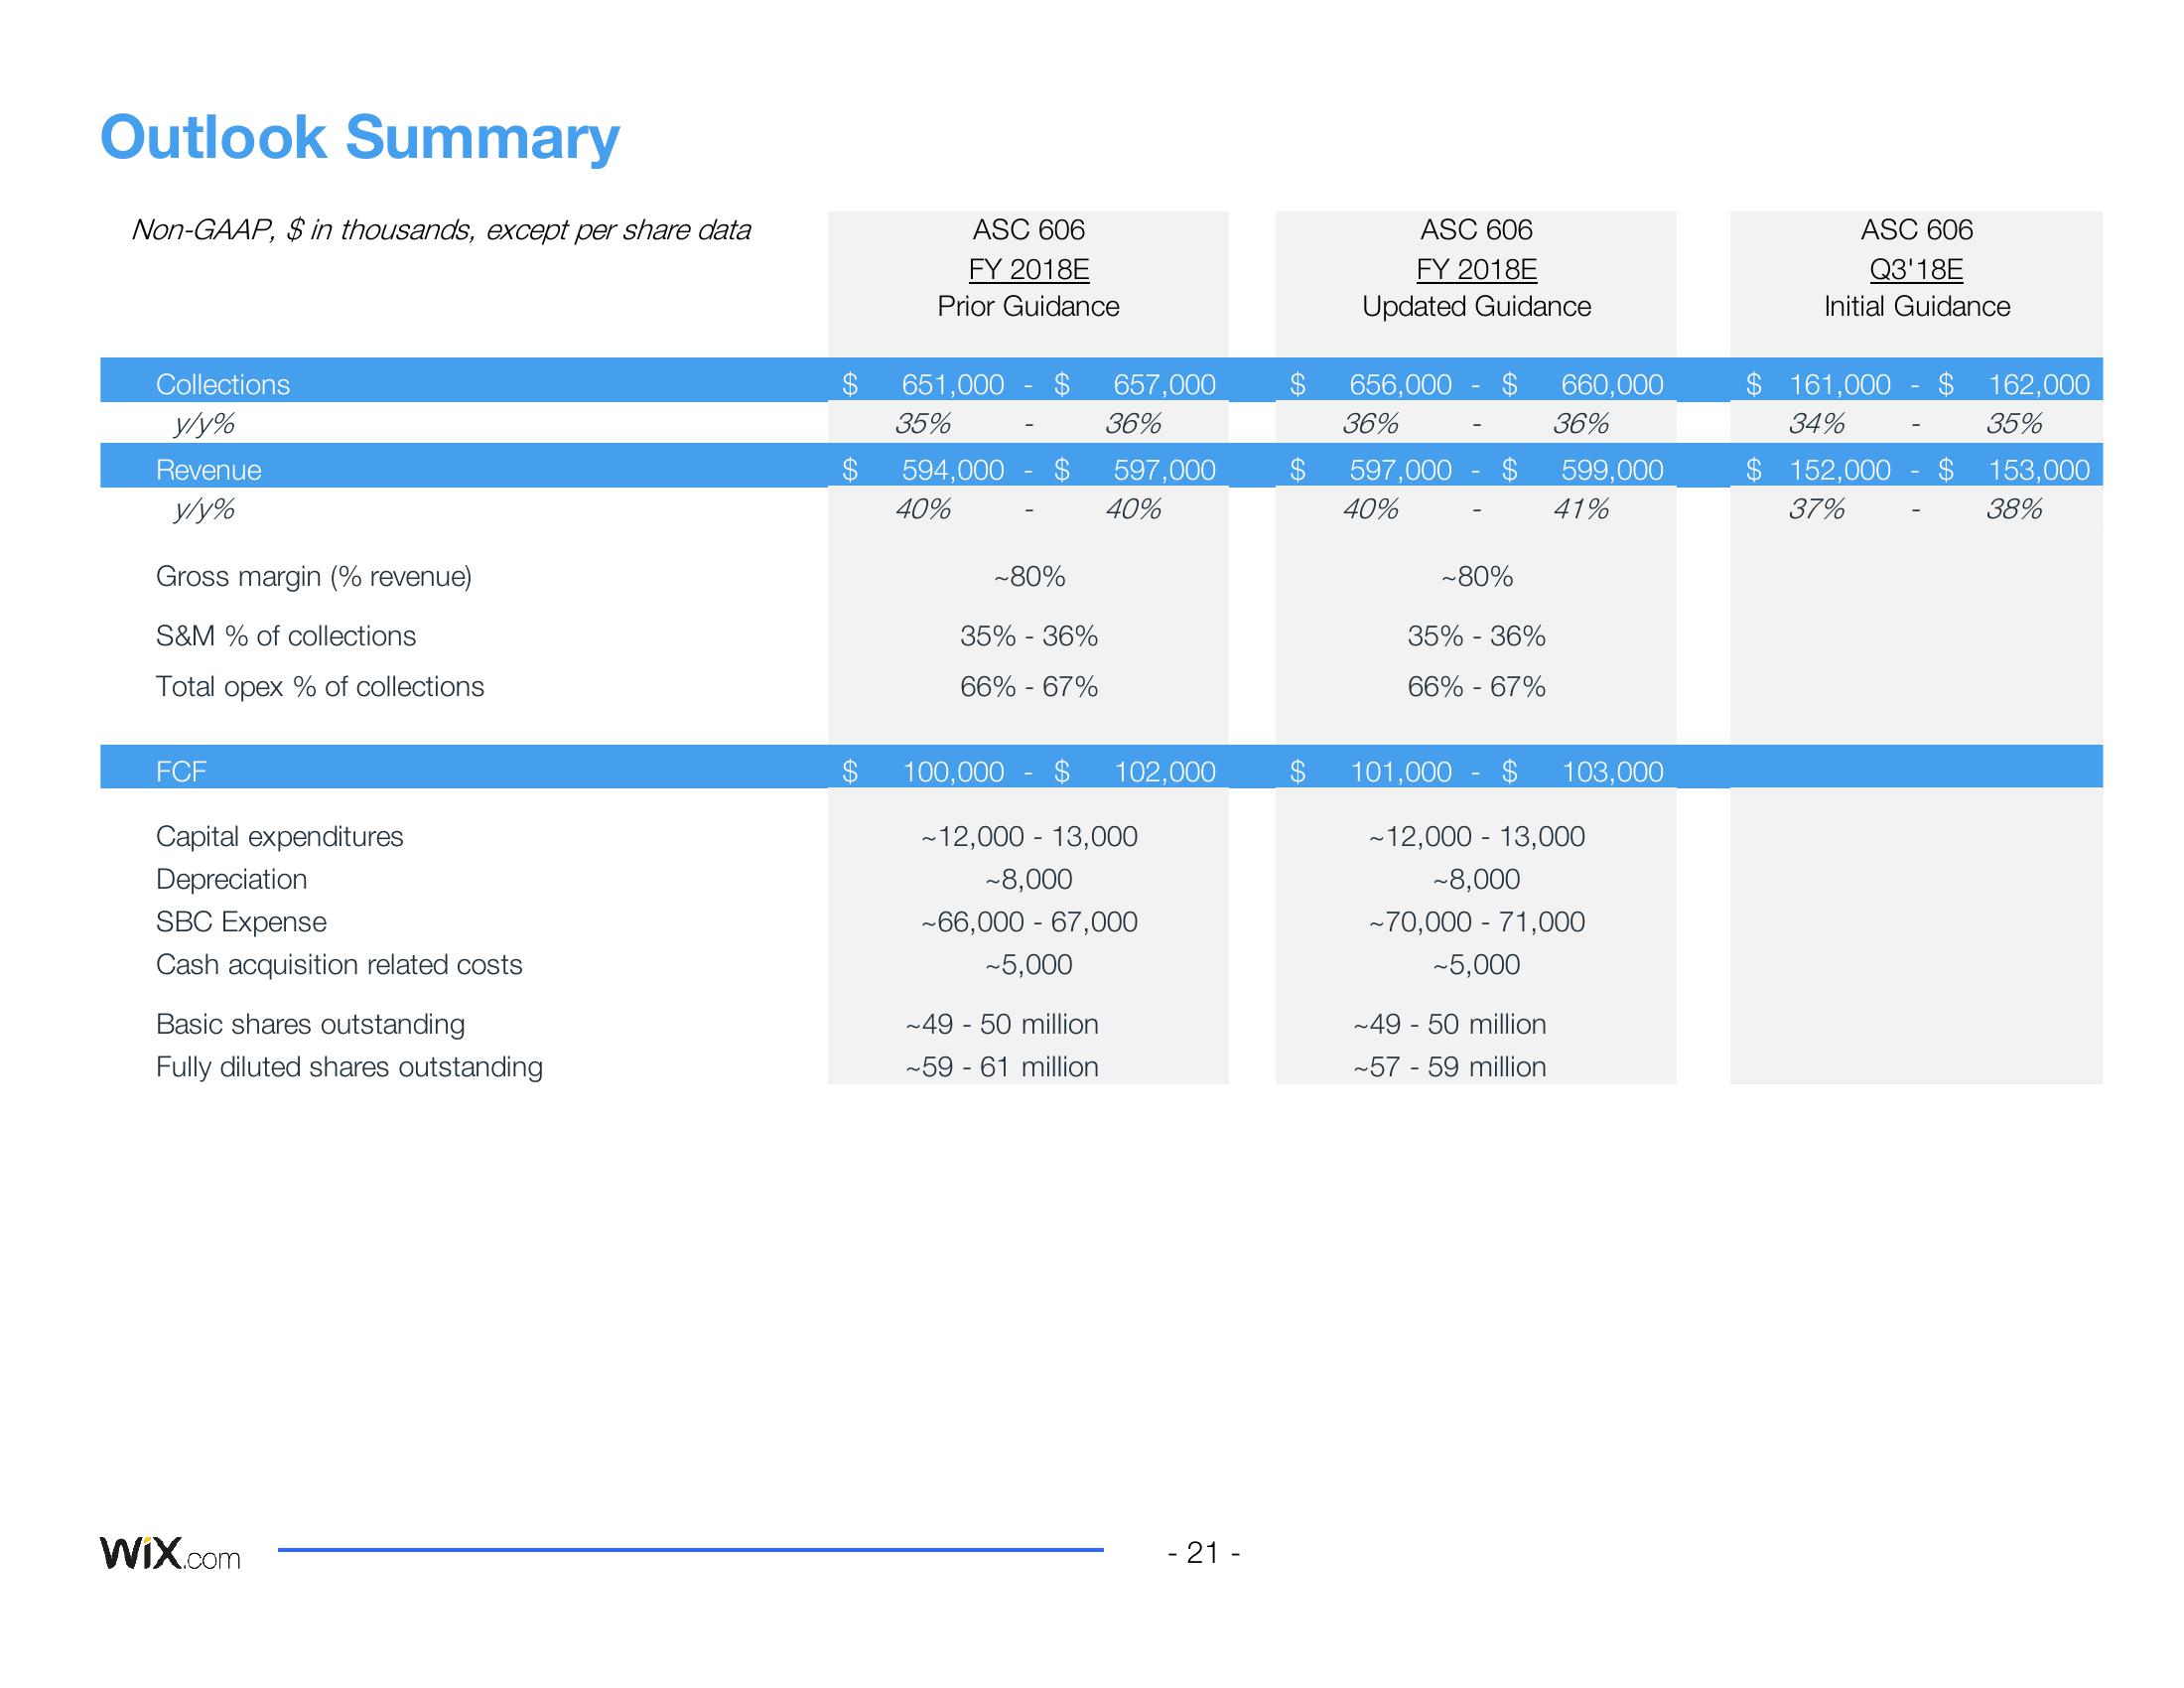
Outlook Summary
Non-GAAP, $ in thousands, except per share data
Collections
y/y%
Revenue
y/y%
Gross margin (% revenue)
S&M % of collections
Total opex % of collections
FCF
Capital expenditures
Depreciation
SBC Expense
Cash acquisition related costs
Basic shares outstanding
Fully diluted shares outstanding
Wix.com
$
$
ASC 606
FY 2018E
Prior Guidance
651,000
35%
594,000
40%
$
~80%
35% - 36%
66% -67%
657,000
36%
597,000
40%
100,000 $ 102,000
~49 - 50 million
-59-61 million
~12,000 - 13,000
~8,000
~66,000 - 67,000
~5,000
- 21 -
ASC 606
FY 2018E
Updated Guidance
656,000
36%
597,000 $
40%
~80%
35% -36%
66% -67%
660,000
36%
599,000
41%
101,000 $ 103,000
~49 50 million
~57 - 59 million
~12,000 - 13,000
~8,000
~70,000 - 71,000
~5,000
ASC 606
Q3'18E
Initial Guidance
$ 161,000
162,000
34%
35%
$152,000 $ 153,000
37%
38%View entire presentation