Olaplex Results Presentation Deck slide image

Olaplex Results Presentation Deck

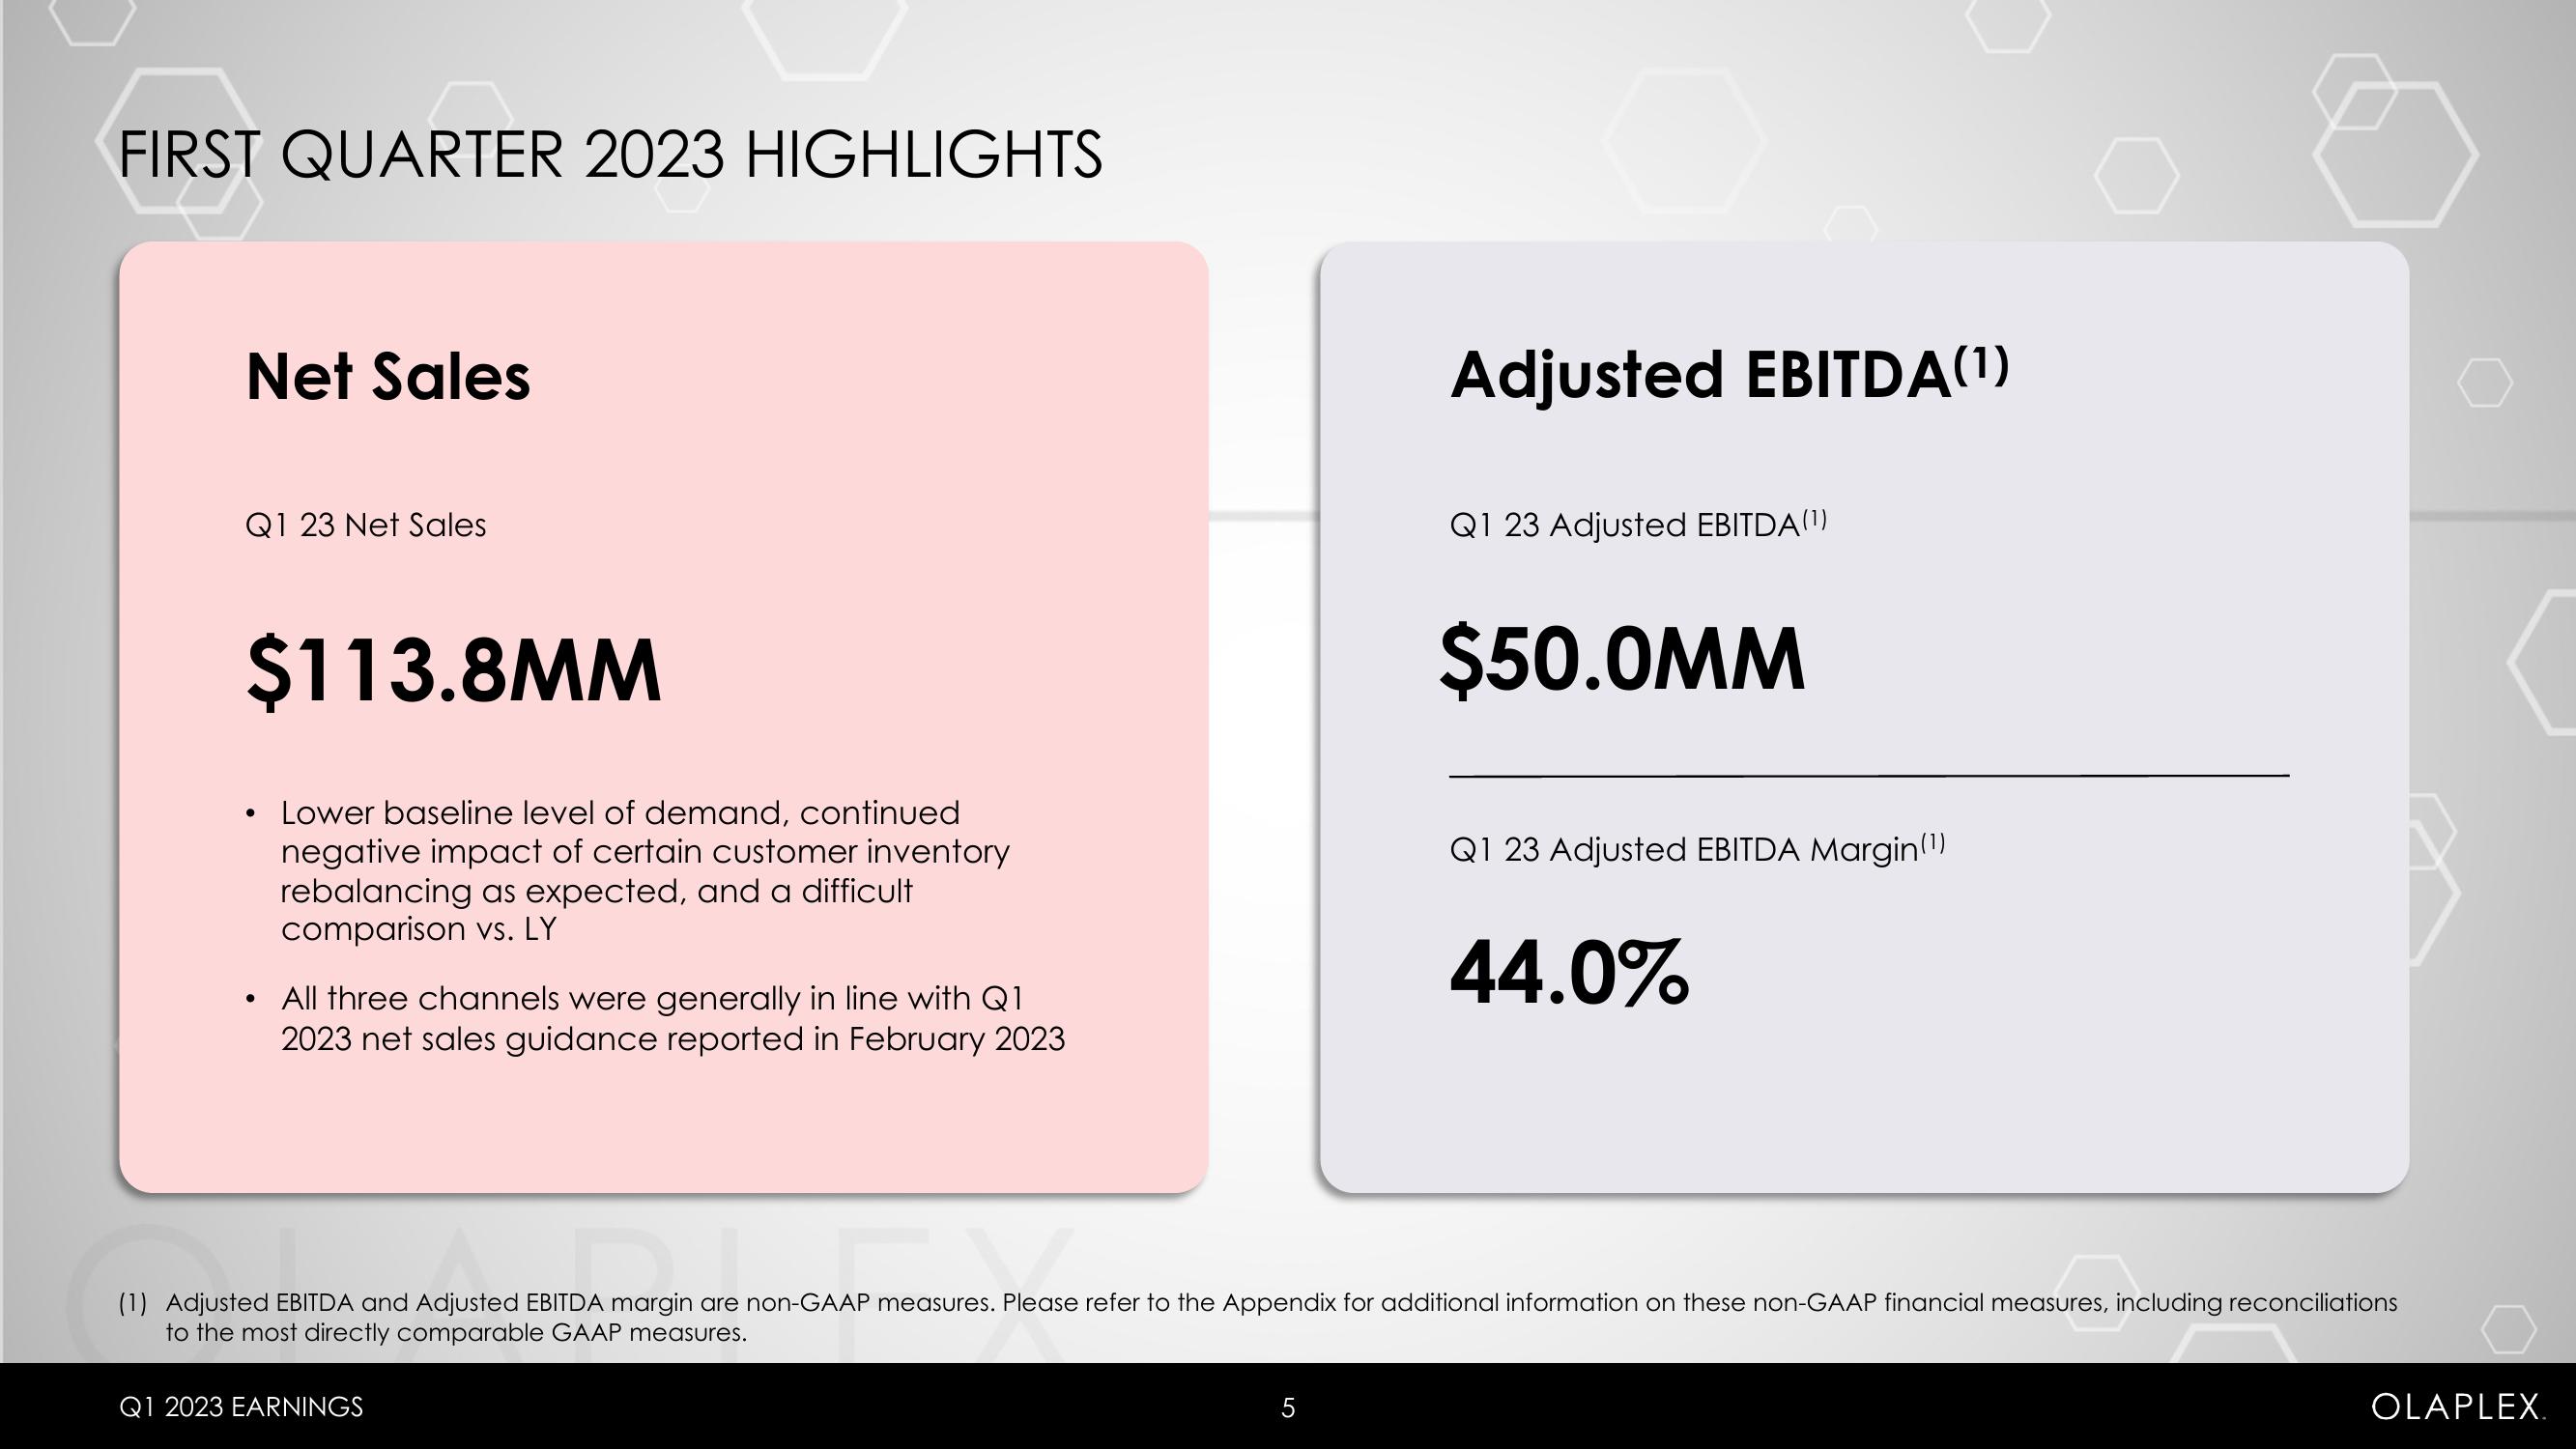
FIRST QUARTER 2023 HIGHLIGHTS Net Sales Q1 23 Net Sales $113.8MM Lower baseline level of demand, continued negative impact of certain customer inventory rebalancing as expected, and a difficult comparison vs. LY ● ● All three channels were generally in line with Q1 2023 net sales guidance reported in February 2023 Adjusted EBITDA(¹) Q1 2023 EARNINGS Q1 23 Adjusted EBITDA (¹) $50.0MM Q1 23 Adjusted EBITDA Margin(¹) 44.0% (1) Adjusted EBITDA and Adjusted EBITDA margin are non-GAAP measures. Please refer to the Appendix for additional information on these non-GAAP financial measures, including reconciliations to the most directly comparable GAAP measures. TDA margin of OLAPLEX.
View entire presentation