Lyft Results Presentation Deck
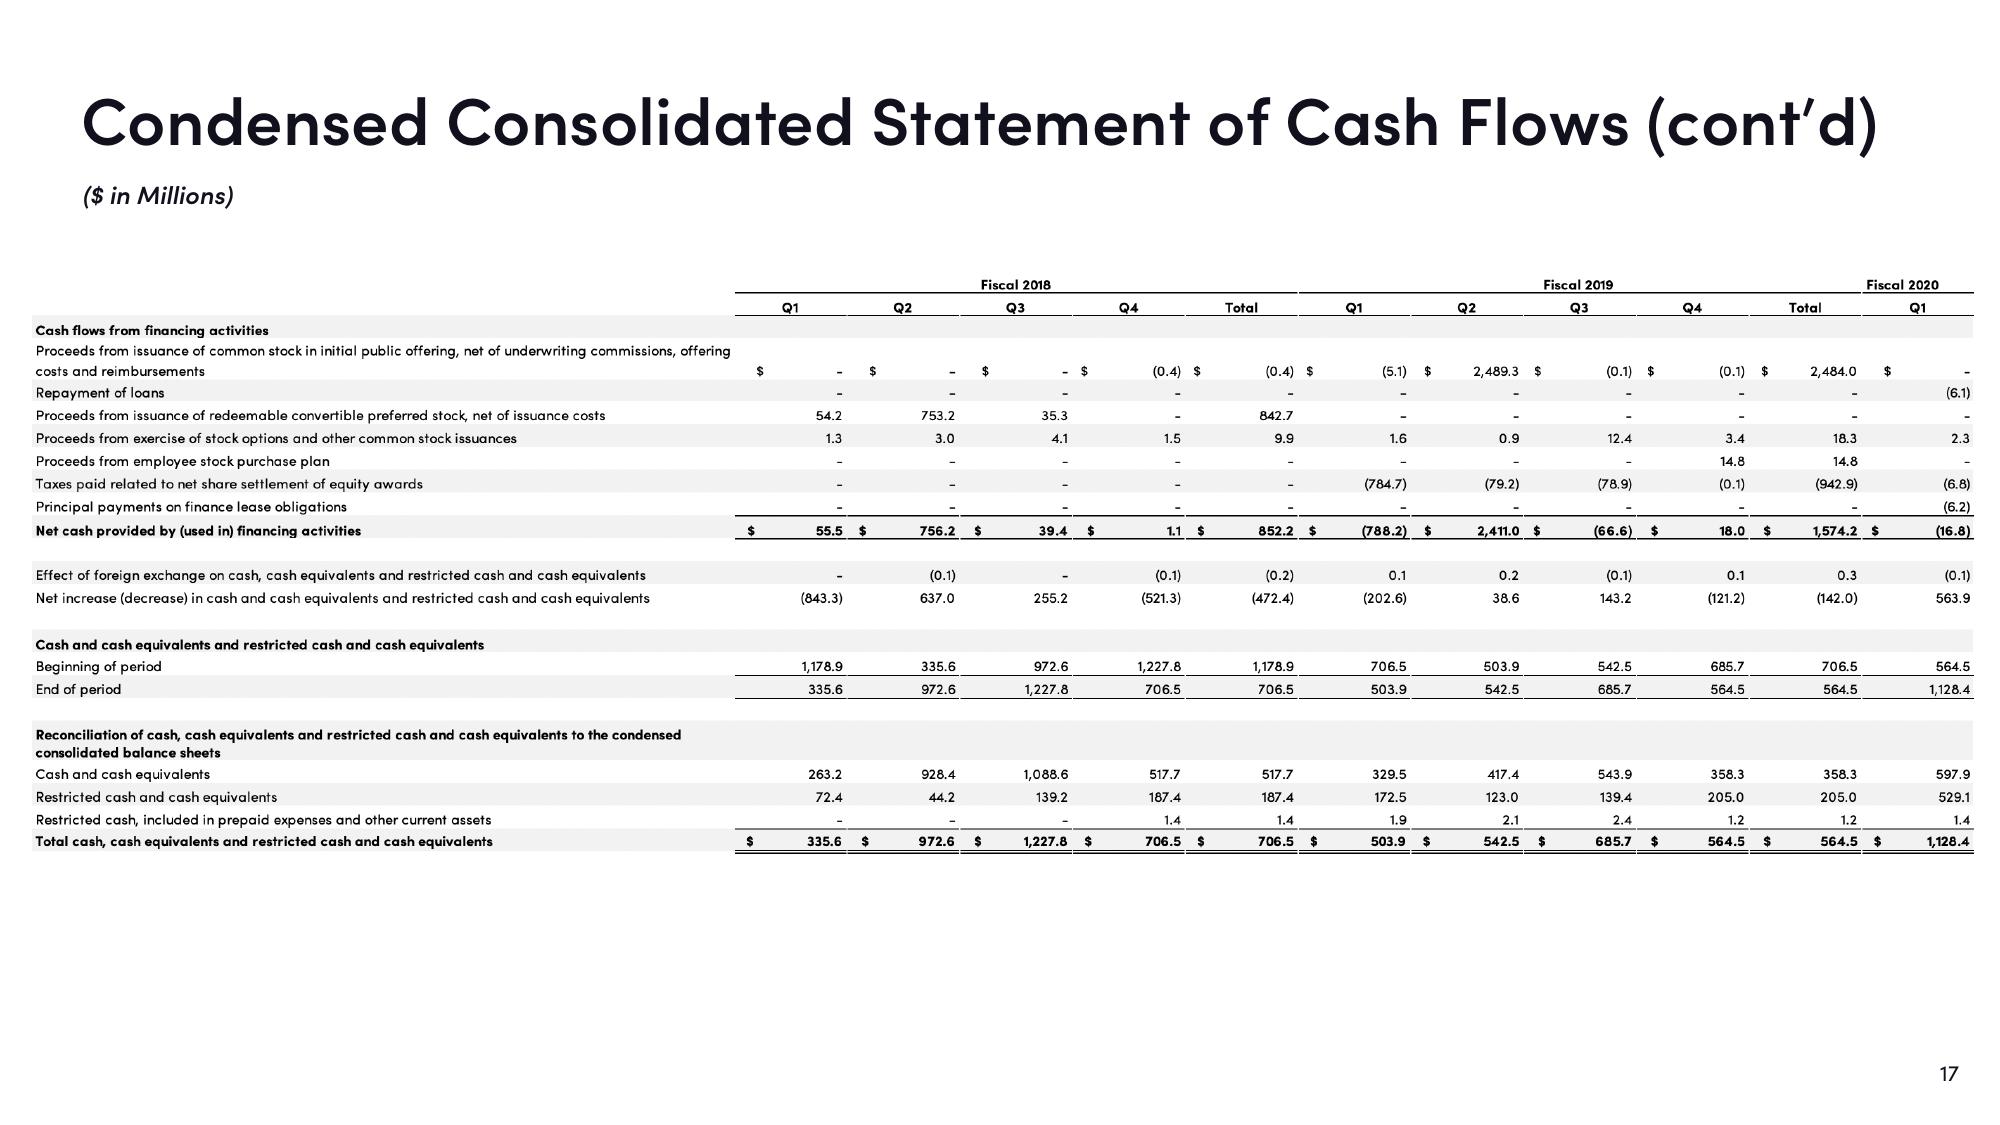
Condensed Consolidated Statement of Cash Flows (cont'd)
($ in Millions)
Cash flows from financing activities
Proceeds from issuance of common stock in initial public offering, net of underwriting commissions, offering
costs and reimbursements
Repayment of loans.
Proceeds from issuance of redeemable convertible preferred stock, net of issuance costs
Proceeds from exercise of stock options and other common stock issuances
Proceeds from employee stock urchase plan
Taxes paid related to net share settlement of equity awards
Principal payments on finance lease obligations
Net cash provided by (used in) financing activities
Effect of foreign exchange on cash, cash equivalents and restricted cash and cash equivalents
Net increase (decrease) in cash and cash equivalents and restricted cash and cash equivalents
Cash and cash equivalents and restricted cash and cash equivalents
Beginning of period
End of period
Reconciliation of cash, cash equivalents and restricted cash and cash equivalents to the condensed
consolidated balance sheets
Cash and cash equivalents
Restricted cash and cash equivalents
Restricted cash, included in prepaid expenses and other current assets
Total cash, cash equivalents and restricted cash and cash equivalents
$
$
$
Q1
54.2
1.3
55.5 $
(843.3)
1,178.9
335.6
263.2
72.4
335.6 $
Q2
753.2
3.0
756.2 $
(0.1)
637.0
335.6
972.6
928.4
44.2
Fiscal 2018
Q3
972.6
$
35.3
4.1
39.4 $
255.2
972.6
1,227.8
$
1,088.6
139.2
1,227.8 $
Q4
(0.4) $
1.5
1.1 $
(0.1)
(521.3)
1,227.8
706.5
517.7
187.4
1.4
706.5 $
Total
(0.4) $
842.7
9.9
852.2 $
(0.2)
(472.4)
1,178.9
706.5
517.7
187.4
1.4
706.5
$
Q1
(5.1)
1.6
(784.7)
(788.2) $
0.1
(202.6)
706.5
503.9
$
329.5
172.5
1.9
503.9
$
Q2
2,489.3
0.9
(79.2)
2,411.0
0.2
38.6
503.9
542.5
417.4
123.0
2.1
542.5
$
$
Fiscal 2019
Q3
$
(0.1) $
12.4
(78.9)
(66.6) $
(0.1)
143.2
542.5
685.7
543.9
139.4
2.4
685.7 $
Q4
(0.1) $
3.4
14.8
(0.1)
18.0
0.1
(121.2)
685.7
564.5
358.3
205.0
1.2
564.5
$
$
Total
2,484.0
18.3
14.8
(942.9)
1,574.2 $
0.3
(142.0)
706.5
564.5
Fiscal 2020
Q1
358.3
205.0
1.2
564.5
$
$
(6.1)
2.3
(6.8)
(6.2)
(16.8)
(0.1)
563.9
564.5
1,128.4
597.9
529.1
1.4
1,128.4
17View entire presentation