Wix Results Presentation Deck
in 000s
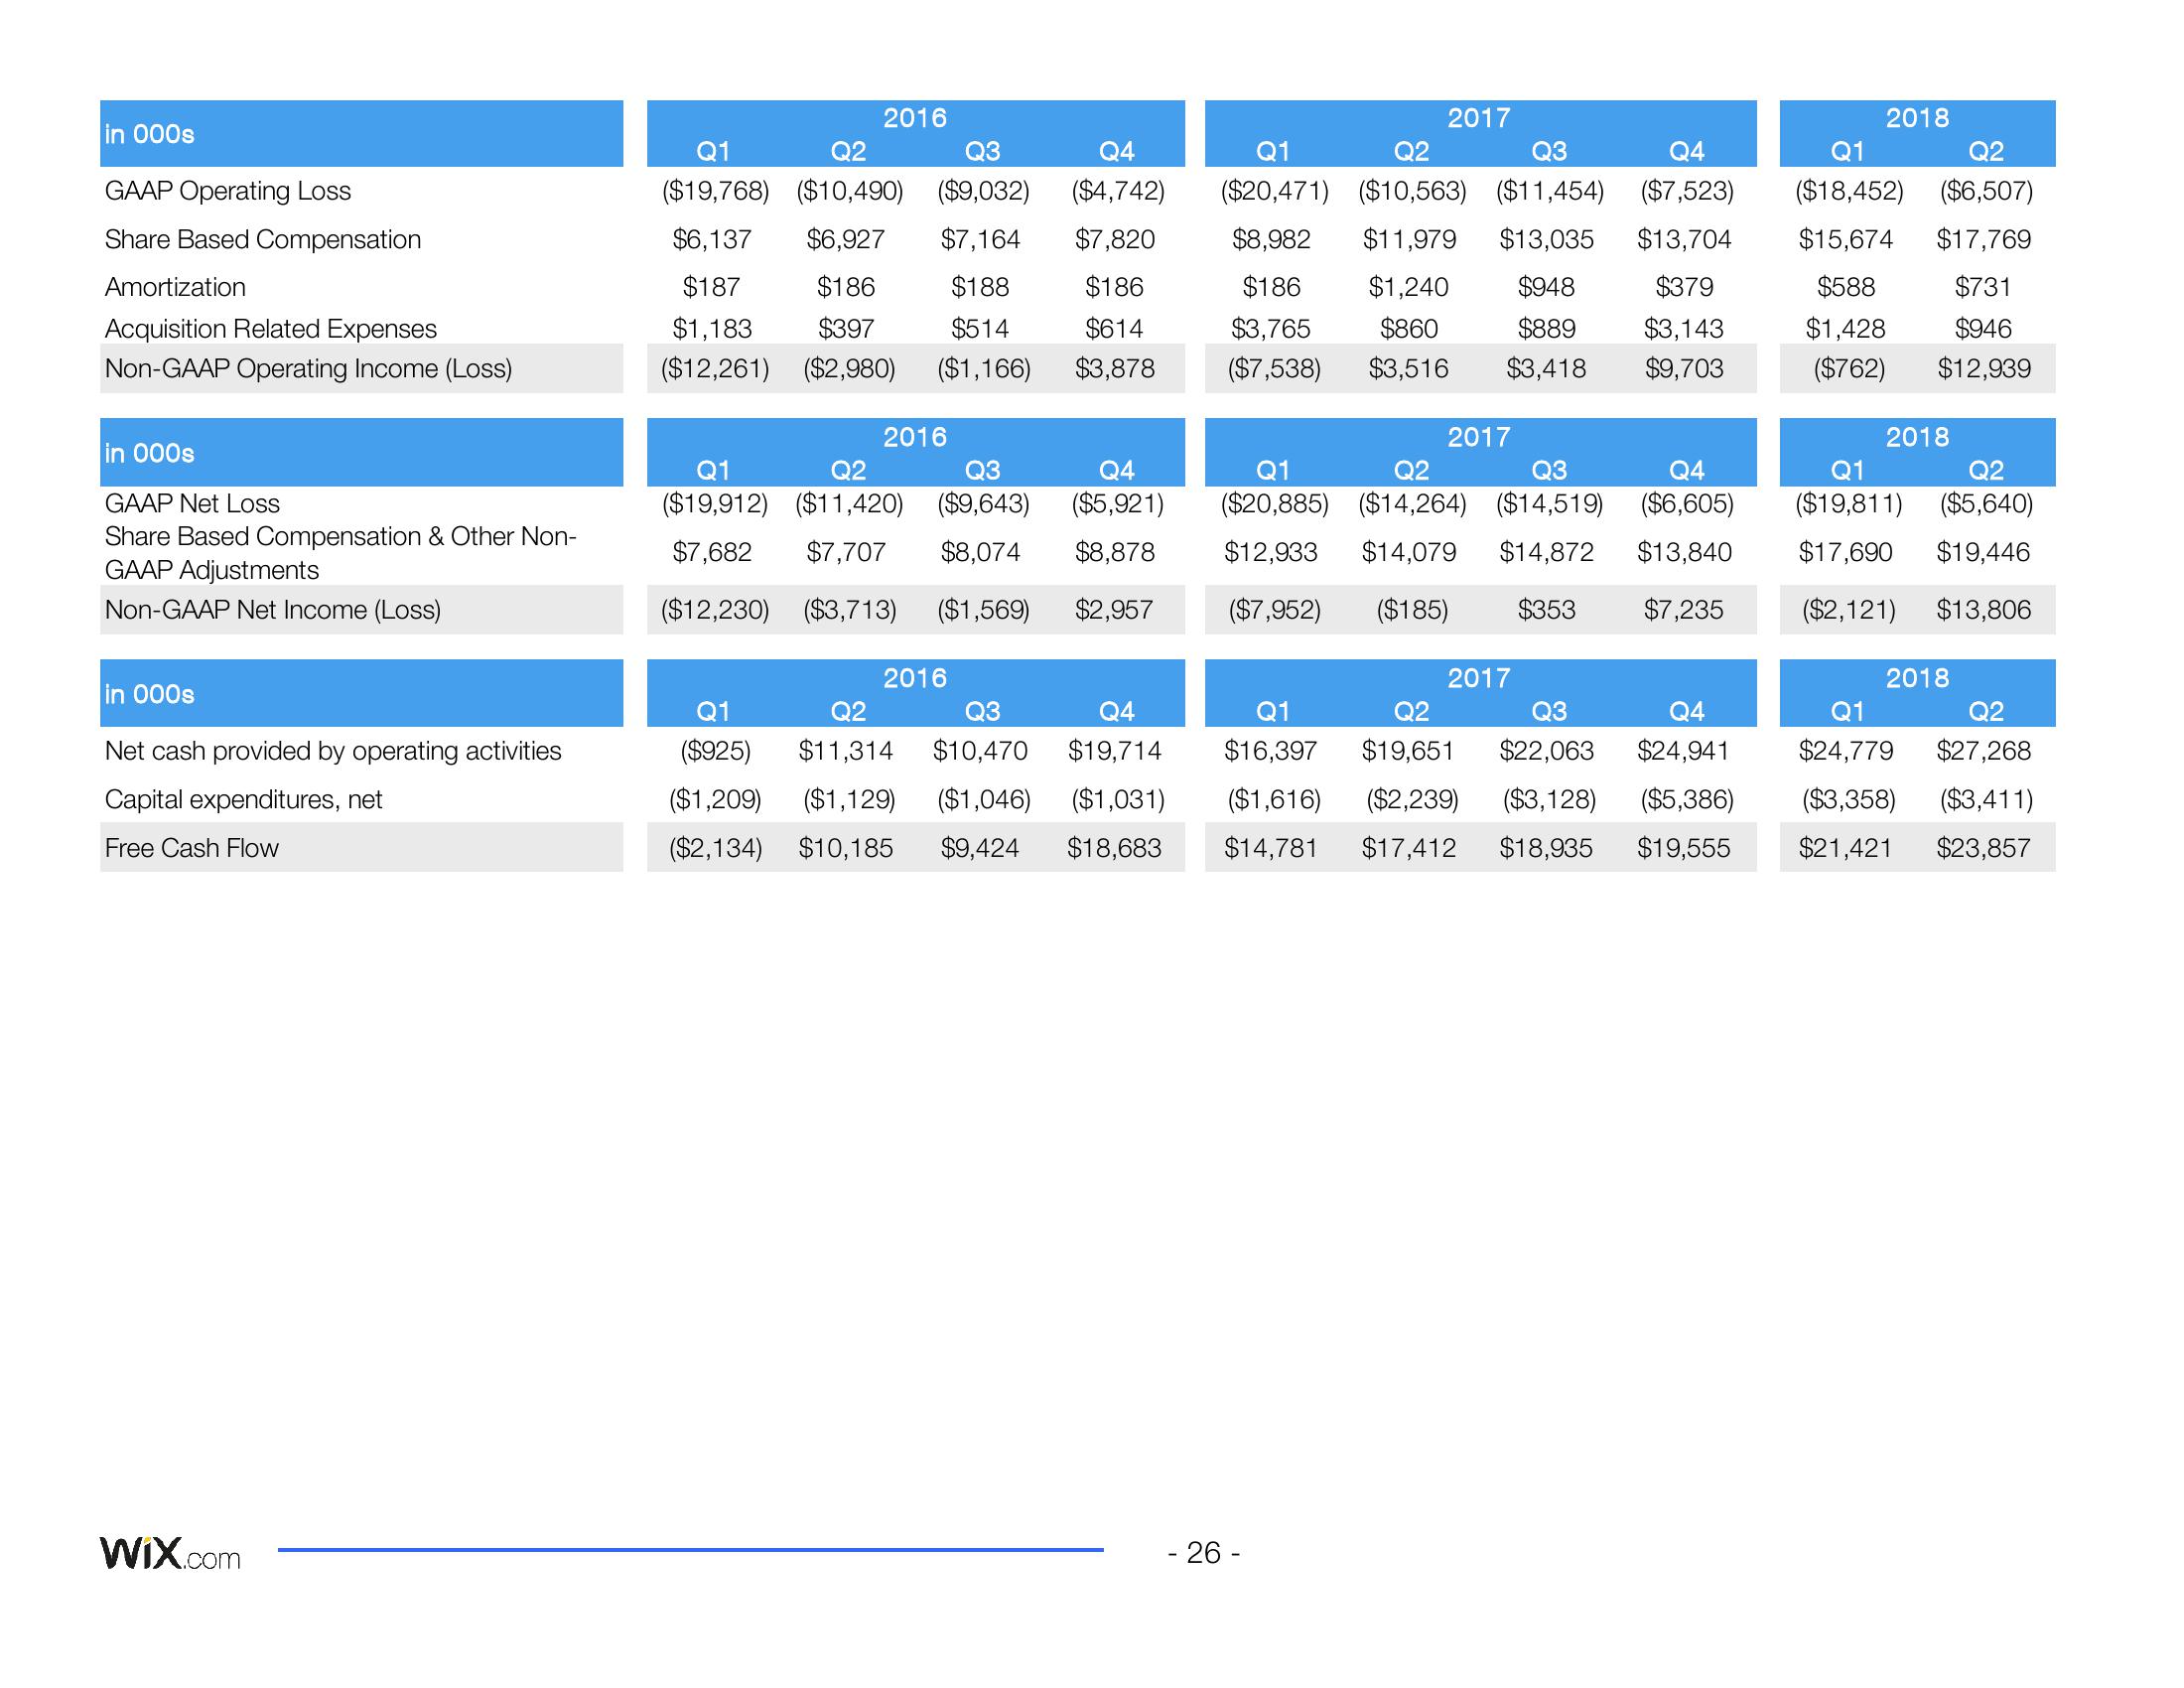
GAAP Operating Loss
Share Based Compensation
Amortization
Acquisition Related Expenses
Non-GAAP Operating Income (Loss)
in 000s
GAAP Net Loss
Share Based Compensation & Other Non-
GAAP Adjustments
Non-GAAP Net Income (Loss)
in 000s
Net cash provided by operating activities
Capital expenditures, net
Free Cash Flow
Wix.com
2016
Q1
Q3
($19,768) ($10,490) ($9,032)
$6,137
$6,927 $7,164
$187
$186
$188
$514
$1,183 $397
($12,261) ($2,980) ($1,166)
2016
Q1
Q2
Q3
($19,912) ($11,420) ($9,643)
$7,682 $7,707 $8,074
($12,230) ($3,713) ($1,569)
2016
Q4
($4,742)
$7,820
$186
$614
$3,878
Q4
($5,921)
$8,878
$2,957
2017
Q4
Q1
Q2
Q3
($20,471) ($10,563) ($11,454) ($7,523)
$8,982
$186 $1,240 $948
$3,765
$860 $889
($7,538) $3,516 $3,418
$11,979 $13,035 $13,704
$379
$3,143
$9,703
- 26-
2017
Q1
Q2
Q3
Q4
($20,885) ($14,264) ($14,519) ($6,605)
$12,933 $14,079 $14,872 $13,840
($7,952) ($185) $353 $7,235
2017
Q1
Q2
Q3
Q4
Q1
Q2
Q3
Q4
($925) $11,314 $10,470 $19,714 $16,397 $19,651 $22,063 $24,941
($1,209) ($1,129) ($1,046) ($1,031) ($1,616) ($2,239) ($3,128) ($5,386)
($2,134) $10,185 $9,424 $18,683 $14,781 $17,412 $18,935 $19,555
2018
Q1
Q2
($18,452) ($6,507)
$15,674 $17,769
$588
$731
$1,428
$946
($762) $12,939
2018
Q1
Q2
($19,811) ($5,640)
$17,690 $19,446
($2,121) $13,806
2018
Q1
Q2
$24,779 $27,268
($3,358) ($3,411)
$21,421 $23,857View entire presentation