Deutsche Bank Results Presentation Deck
Commercial Real Estate (CRE)
Focus portfolio comprised of IB and CB non-recourse CRE lending
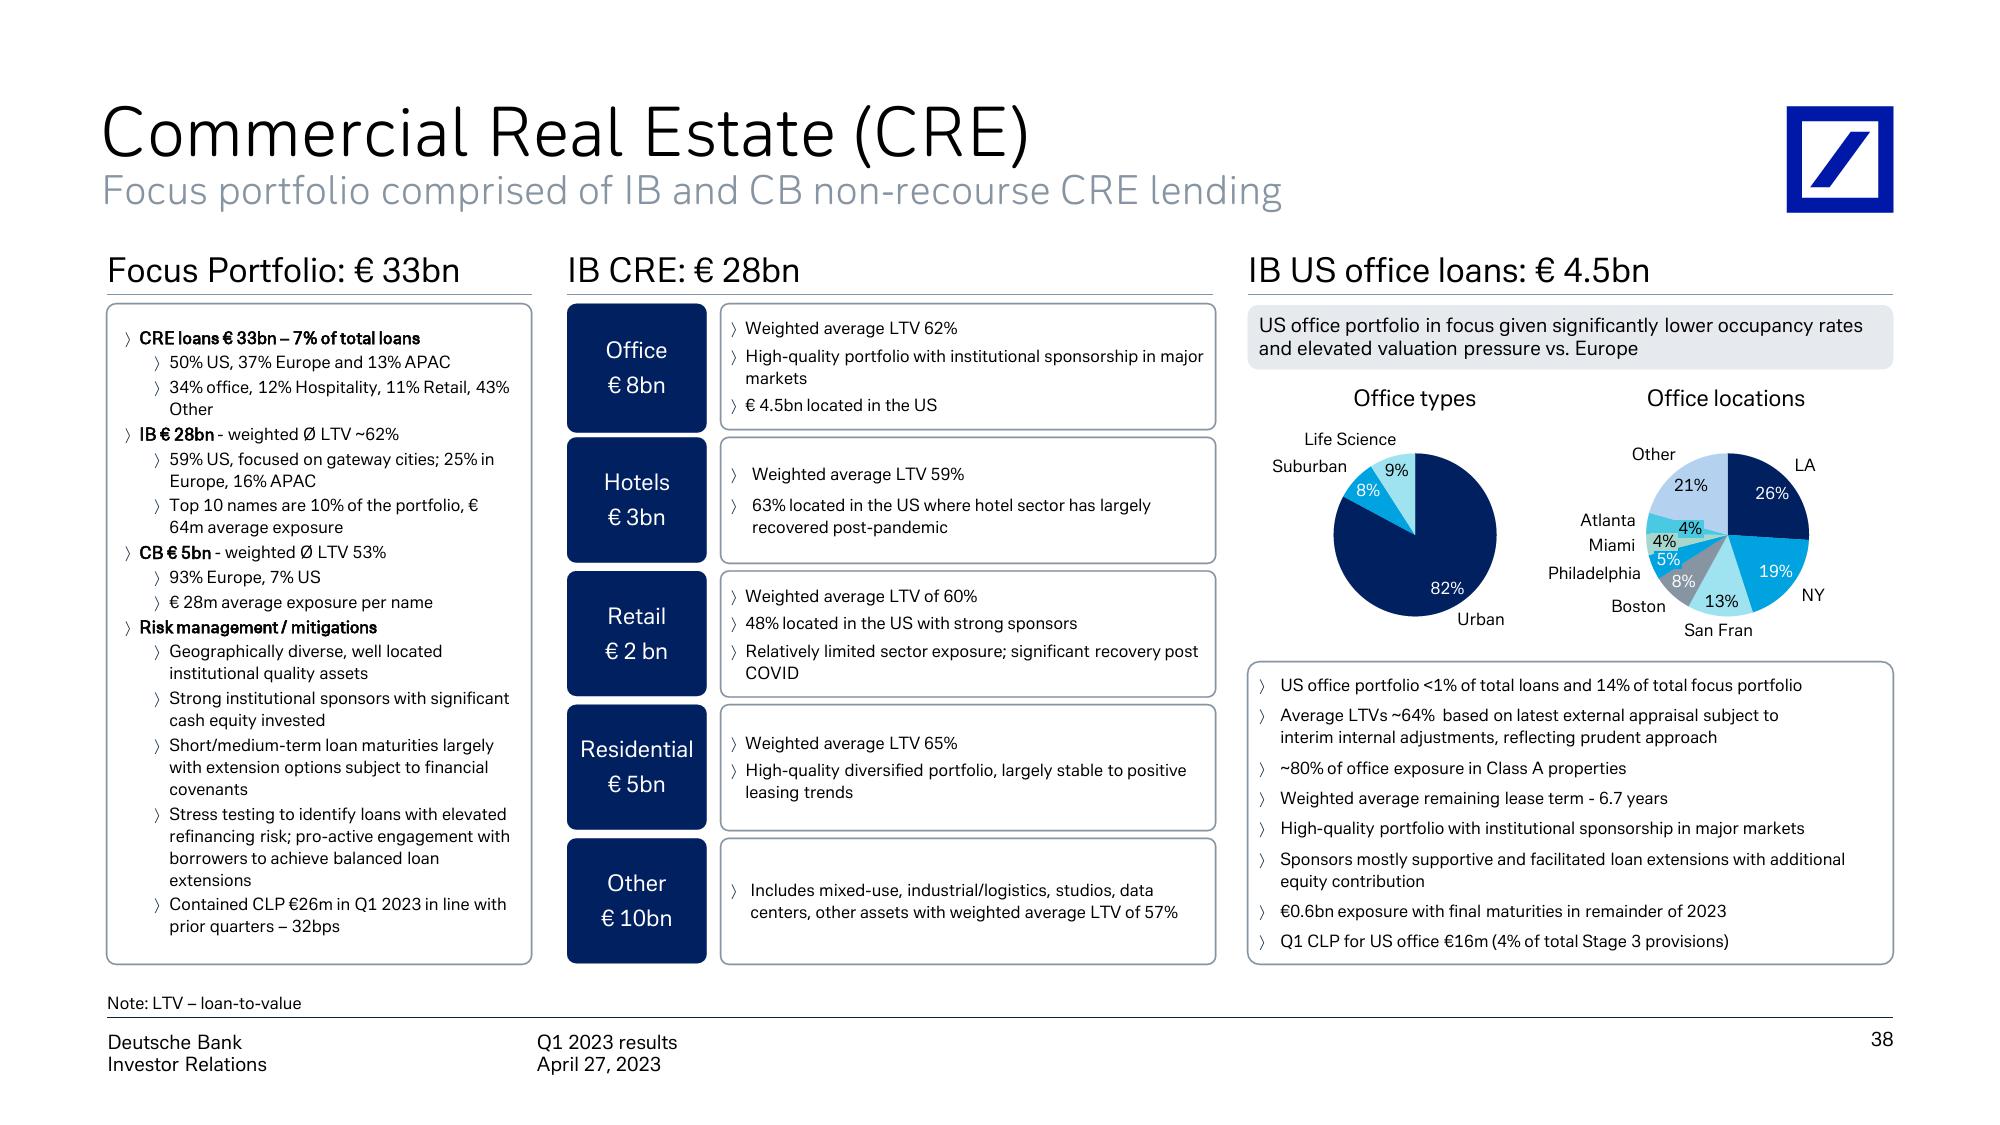
Focus Portfolio: € 33bn
IB CRE: € 28bn
> CRE loans € 33bn -7% of total loans
> 50% US, 37% Europe and 13% APAC
> 34% office, 12% Hospitality, 11% Retail, 43%
Other
> IB € 28bn - weighted ØLTV~62%
> 59% US, focused on gateway cities; 25% in
Europe, 16% APAC
> Top 10 names are 10% of the portfolio, €
64m average exposure
> CB € 5bn - weighted Ø LTV 53%
> 93% Europe, 7% US
> € 28m average exposure per name
> Risk management / mitigations
> Geographically diverse, well located.
institutional quality assets
> Strong institutional sponsors with significant
cash equity invested
> Short/medium-term loan maturities largely
with extension options subject to financial
covenants
> Stress testing to identify loans with elevated
refinancing risk; pro-active engagement with
borrowers to achieve balanced loan
extensions
> Contained CLP €26m in Q1 2023 in line with
prior quarters - 32bps
Note: LTV loan-to-value
Deutsche Bank
Investor Relations
Office
€ 8bn
Hotels
€ 3bn
Retail
€ 2 bn
Residential
€ 5bn
Other
€ 10bn
Q1 2023 results
April 27, 2023
> Weighted average LTV 62%
> High-quality portfolio with institutional sponsorship in major
markets
> € 4.5bn located in the US
> Weighted average LTV 59%
> 63% located in the US where hotel sector has largely
recovered post-pandemic
> Weighted average LTV of 60%
> 48% located in the US with strong sponsors
> Relatively limited sector exposure; significant recovery post
COVID
> Weighted average LTV 65%
> High-quality diversified portfolio, largely stable to positive
leasing trends
> Includes mixed-use, industrial/logistics, studios, data
centers, other assets with weighted average LTV of 57%
IB US office loans: € 4.5bn
US office portfolio in focus given significantly lower occupancy rates
and elevated valuation pressure vs. Europe
Office types
Life Science
Suburban 9%
8%
82%
Urban
Office locations.
Other
21%
Atlanta
4%
Miami 4%
5%
Philadelphia
8%
Boston
13%
San Fran
/
26%
19%
LA
NY
> US office portfolio <1% of total loans and 14% of total focus portfolio
> Average LTVs ~64% based on latest external appraisal subject to
interim internal adjustments, reflecting prudent approach
> ~80% of office exposure in Class A properties
> Weighted average remaining lease term - 6.7 years
> High-quality portfolio with institutional sponsorship in major markets
> Sponsors mostly supportive and facilitated loan extensions with additional
equity contribution
> €0.6bn exposure with final maturities in remainder of 2023
> Q1 CLP for US office €16m (4% of total Stage 3 provisions)
38View entire presentation