Melrose Mergers and Acquisitions Presentation Deck
Automotive: overview
Melrose
£m
Revenue
EBITDA³
EBITDA3 margin %
Operating profit
Operating margin %
3
1
O
2
Adjusted¹
results
H1 2022
1.
Buy
Improve 2.
Sell
3.
4.
1,997
190
9.5%
78
3.9%
Revenue by destination
Growth vs
H1 2021
(3%)²
(22%)
-2.6ppts
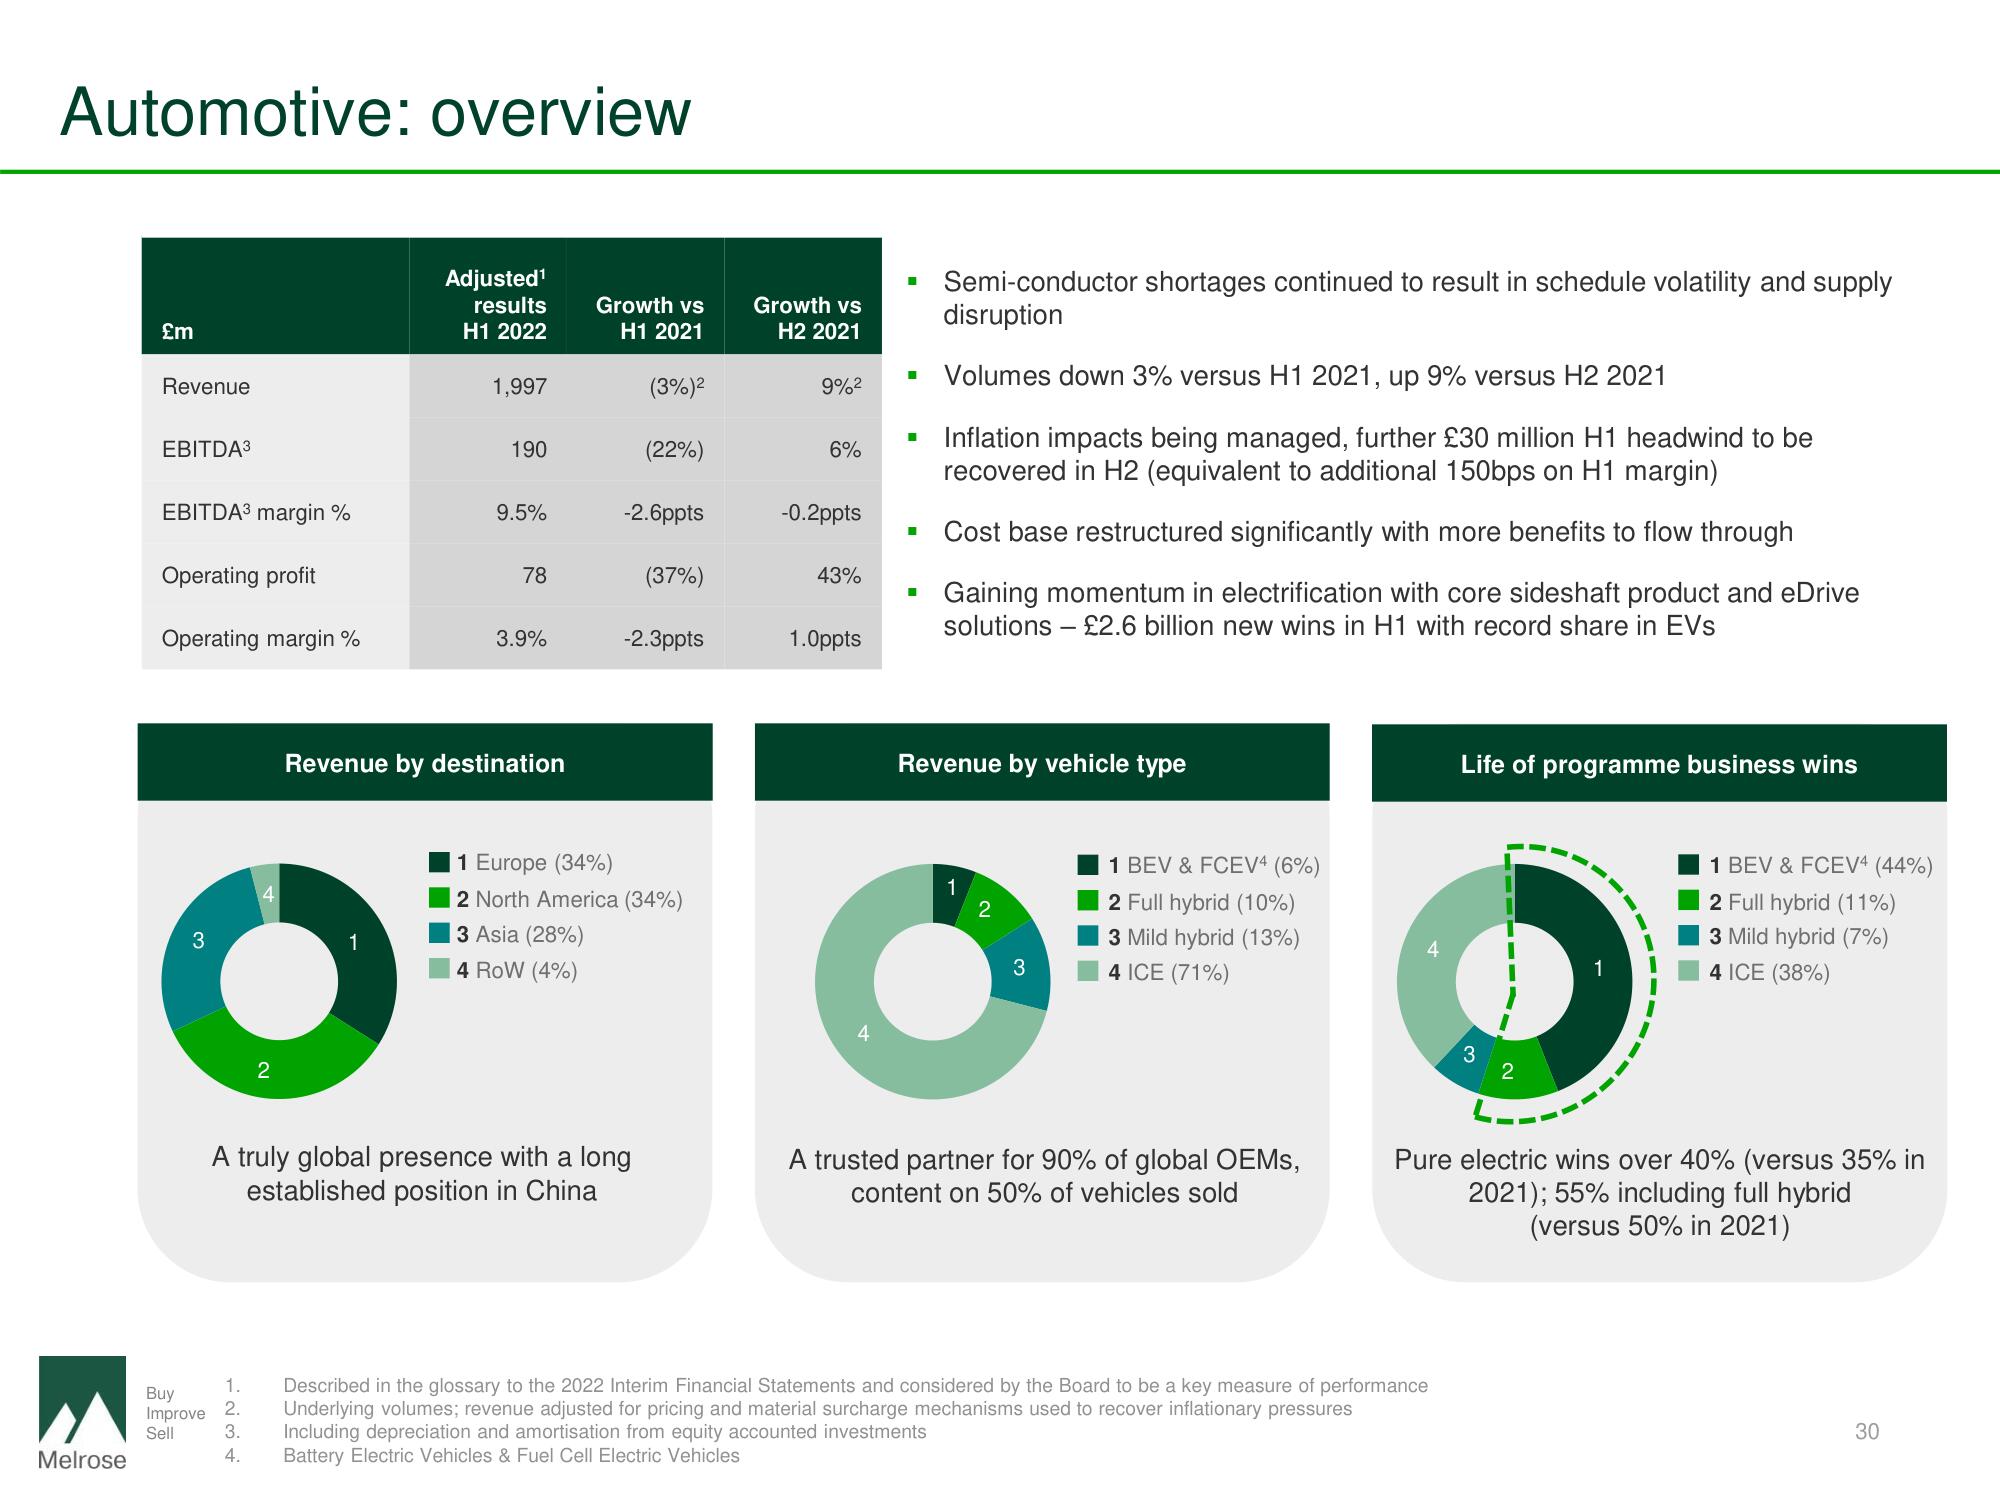
A truly global presence with a long
established position in China
(37%)
-2.3ppts
Europe (34%)
North America (34%)
3 Asia (28%)
4 ROW (4%)
Growth vs
H2 2021
9%²
6%
-0.2ppts
43%
1.0ppts
■
Semi-conductor shortages continued to result in schedule volatility and supply
disruption
Volumes down 3% versus H1 2021, up 9% versus H2 2021
Inflation impacts being managed, further £30 million H1 headwind to be
recovered in H2 (equivalent to additional 150bps on H1 margin)
Cost base restructured significantly with more benefits to flow through
Gaining momentum in electrification with core sideshaft product and eDrive
solutions - £2.6 billion new wins in H1 with record share in EVs
Revenue by vehicle type
1
2
3
1 BEV & FCEV4 (6%)
2 Full hybrid (10%)
3 Mild hybrid (13%)
4 ICE (71%)
A trusted partner for 90% of global OEMs,
content on 50% of vehicles sold
Life of programme business wins
Described in the glossary to the 2022 Interim Financial Statements and considered by the Board to be a key measure of performance
Underlying volumes; revenue adjusted for pricing and material surcharge mechanisms used to recover inflationary pressures
Including depreciation and amortisation from equity accounted investments
Battery Electric Vehicles & Fuel Cell Electric Vehicles
3
2
1 BEV & FCEV4 (44%)
2 Full hybrid (11%)
3 Mild hybrid (7%)
4 ICE (38%)
Pure electric wins over 40% (versus 35% in
2021); 55% including full hybrid
(versus 50% in 2021)
30View entire presentation