Mercury Systems FY20 Investor Day Presentation
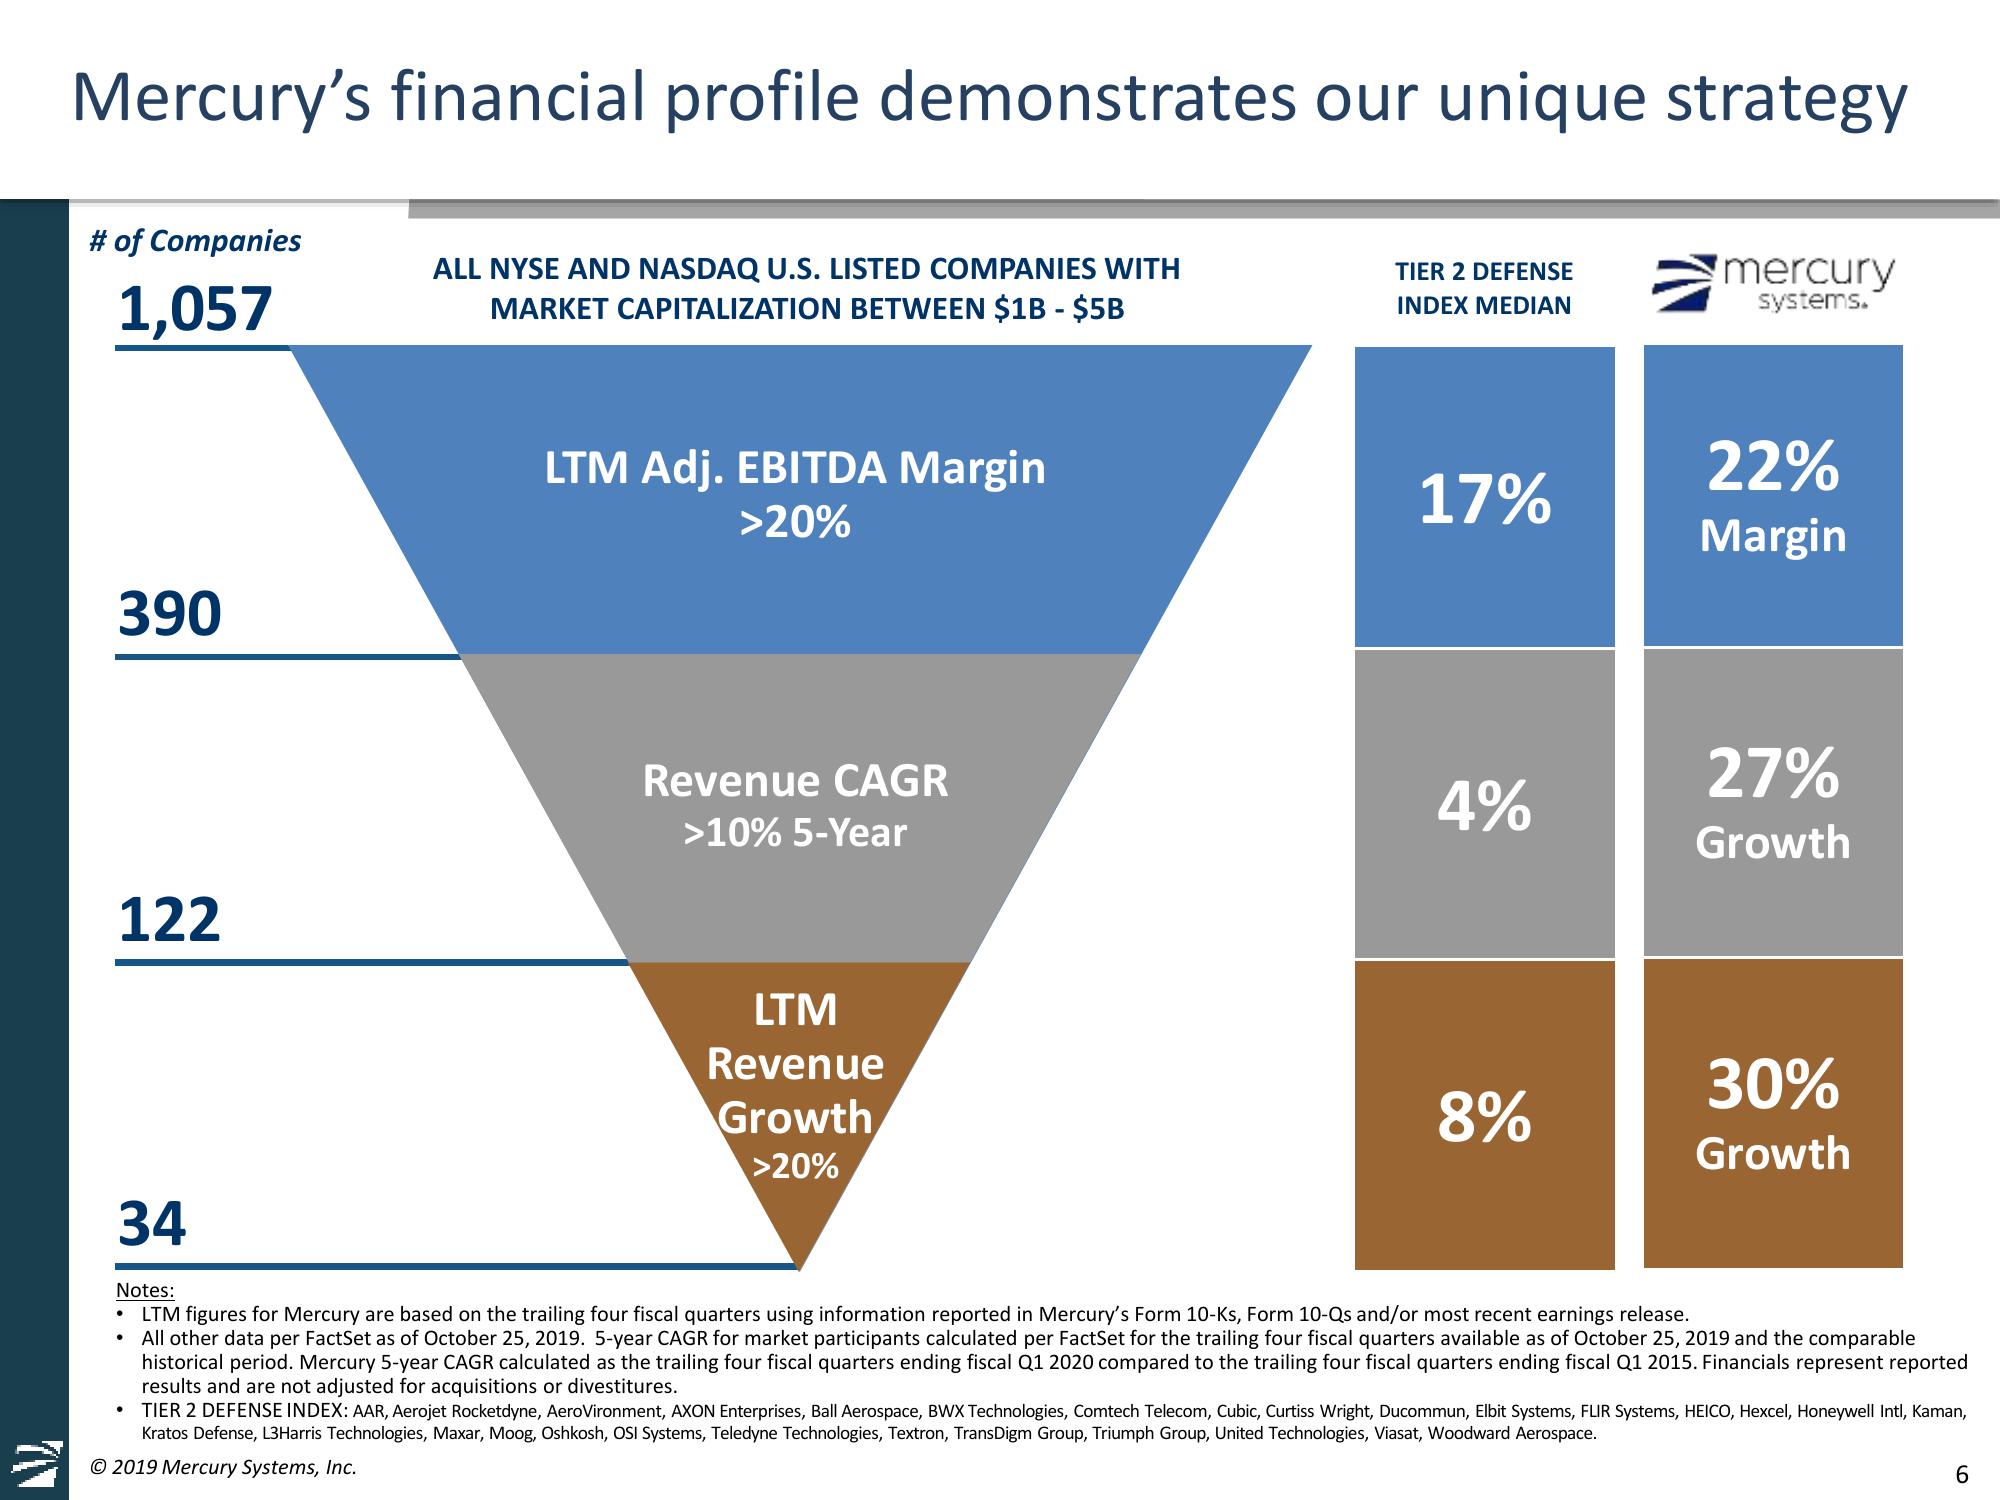
Mercury's financial profile demonstrates our unique strategy
# of Companies
1,057
390
122
34
.
●
ALL NYSE AND NASDAQ U.S. LISTED COMPANIES WITH
MARKET CAPITALIZATION BETWEEN $1B - $5B
LTM Adj. EBITDA Margin
>20%
●
Revenue CAGR
>10% 5-Year
LTM
Revenue
Growth
>20%
TIER 2 DEFENSE
INDEX MEDIAN
17%
4%
8%
mercury
systems.
22%
Margin
Notes:
LTM figures for Mercury are based on the trailing four fiscal quarters using information reported in Mercury's Form 10-Ks, Form 10-Qs and/or most recent earnings release.
All other data per FactSet as of October 25, 2019. 5-year CAGR for market participants calculated per FactSet for the trailing four fiscal quarters available as of October 25, 2019 and the comparable
historical period. Mercury 5-year CAGR calculated as the trailing four fiscal quarters ending fiscal Q1 2020 compared to the trailing four fiscal quarters ending fiscal Q1 2015. Financials represent reported
results and are not adjusted for acquisitions or divestitures.
27%
Growth
30%
Growth
TIER 2 DEFENSE INDEX: AAR, Aerojet Rocketdyne, AeroVironment, AXON Enterprises, Ball Aerospace, BWX Technologies, Comtech Telecom, Cubic, Curtiss Wright, Ducommun, Elbit Systems, FLIR Systems, HEICO, Hexcel, Honeywell Intl, Kaman,
Kratos Defense, L3Harris Technologies, Maxar, Moog, Oshkosh, OSI Systems, Teledyne Technologies, Textron, TransDigm Group, Triumph Group, United Technologies, Viasat, Woodward Aerospace.
© 2019 Mercury Systems, Inc.
6View entire presentation