Energy Vault SPAC Presentation Deck
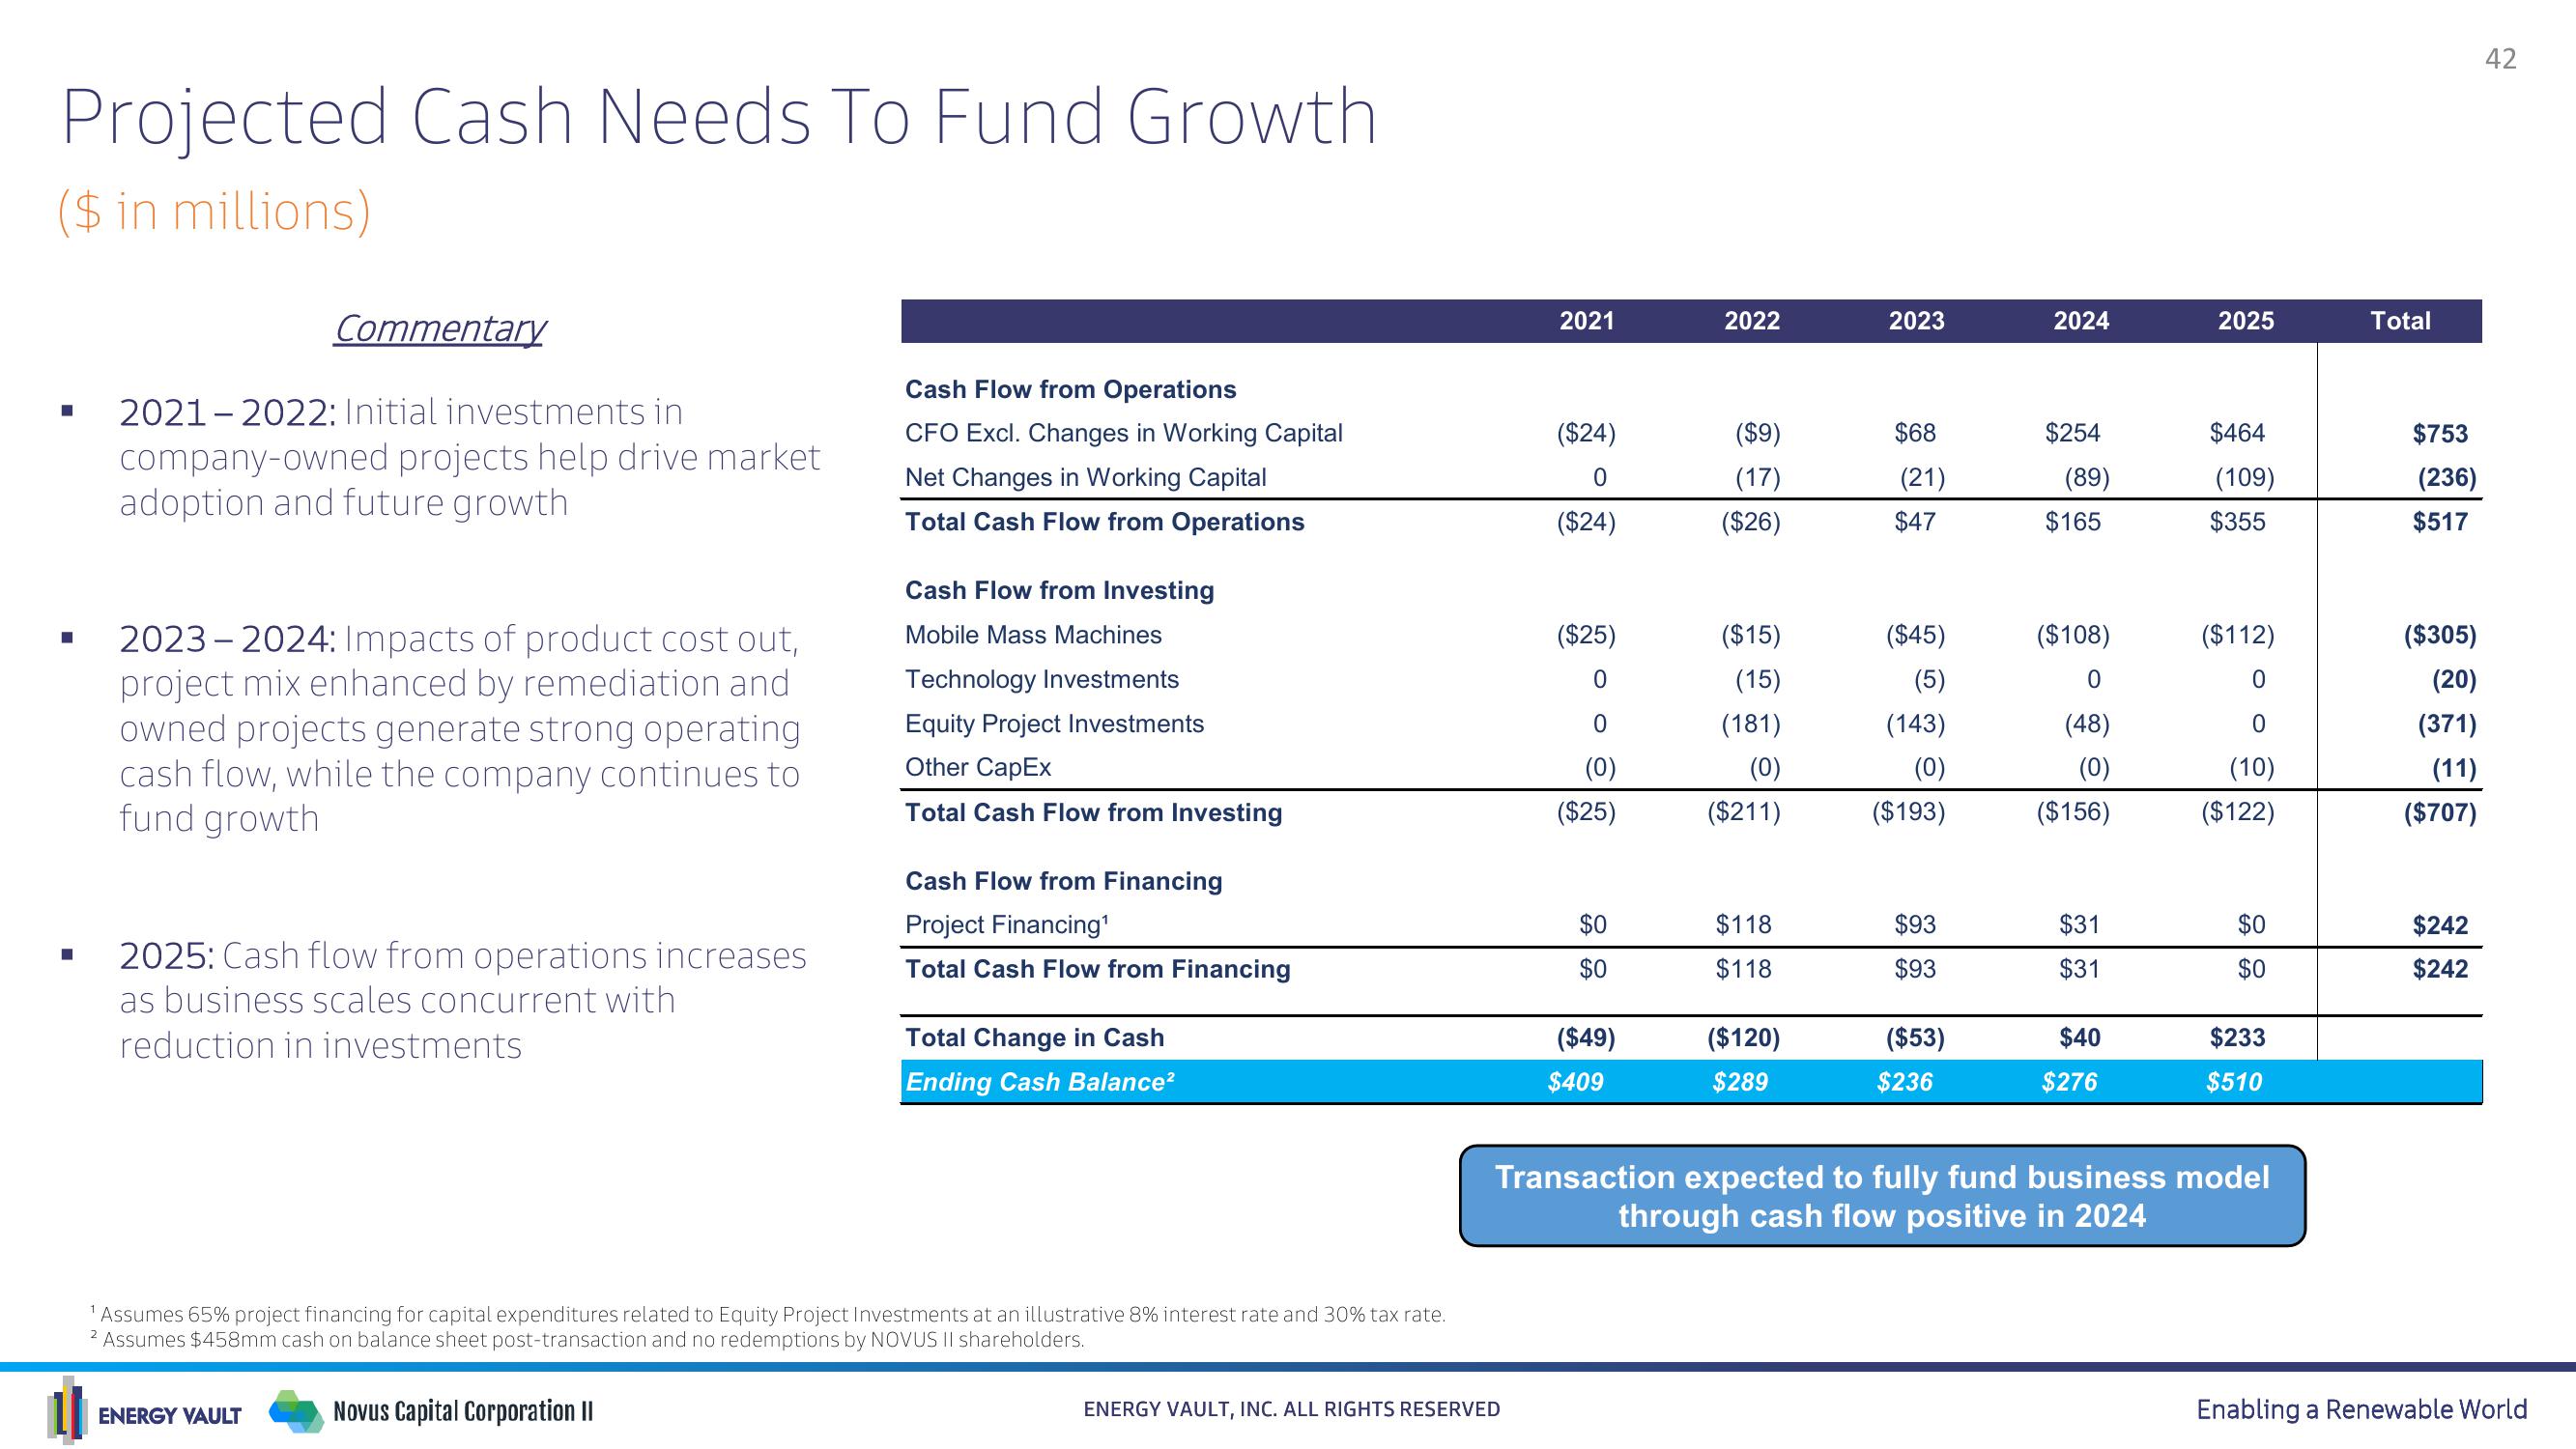
Projected Cash Needs To Fund Growth.
($ in millions)
■
■
■
Commentary
2021 2022: Initial investments in
company-owned projects help drive market
adoption and future growth
2023 2024: Impacts of product cost out,
project mix enhanced by remediation and
owned projects generate strong operating
cash flow, while the company continues to
fund growth
2025: Cash flow from operations increases
as business scales concurrent with
reduction in investments
ENERGY VAULT
Cash Flow from Operations
CFO Excl. Changes in Working Capital
Net Changes in Working Capital
Total Cash Flow from Operations
Cash Flow from Investing
Mobile Mass Machines
Technology Investments
Equity Project Investments
Other CapEx
Total Cash Flow from Investing
Cash Flow from Financing
Project Financing¹
Total Cash Flow from Financing
Total Change in Cash
Ending Cash Balance²
Assumes 65% project financing for capital expenditures related to Equity Project Investments at an illustrative 8% interest rate and 30% tax rate.
² Assumes $458mm cash on balance sheet post-transaction and no redemptions by NOVUS II shareholders.
Novus Capital Corporation II
2021
ENERGY VAULT, INC. ALL RIGHTS RESERVED
($24)
0
($24)
($25)
0
0
(0)
($25)
$0
$0
($49)
$409
2022
($9)
(17)
($26)
($15)
(15)
(181)
(0)
($211)
$118
$118
($120)
$289
2023
$68
(21)
$47
($45)
(5)
(143)
(0)
($193)
$93
$93
($53)
$236
2024
$254
(89)
$165
($108)
0
(48)
(0)
($156)
$31
$31
$40
$276
2025
$464
(109)
$355
($112)
0
0
(10)
($122)
$0
$0
$233
$510
Transaction expected to fully fund business model
through cash flow positive in 2024
Total
$753
(236)
$517
($305)
(20)
(371)
(11)
($707)
$242
$242
42
Enabling a Renewable WorldView entire presentation