Tradeweb Results Presentation Deck
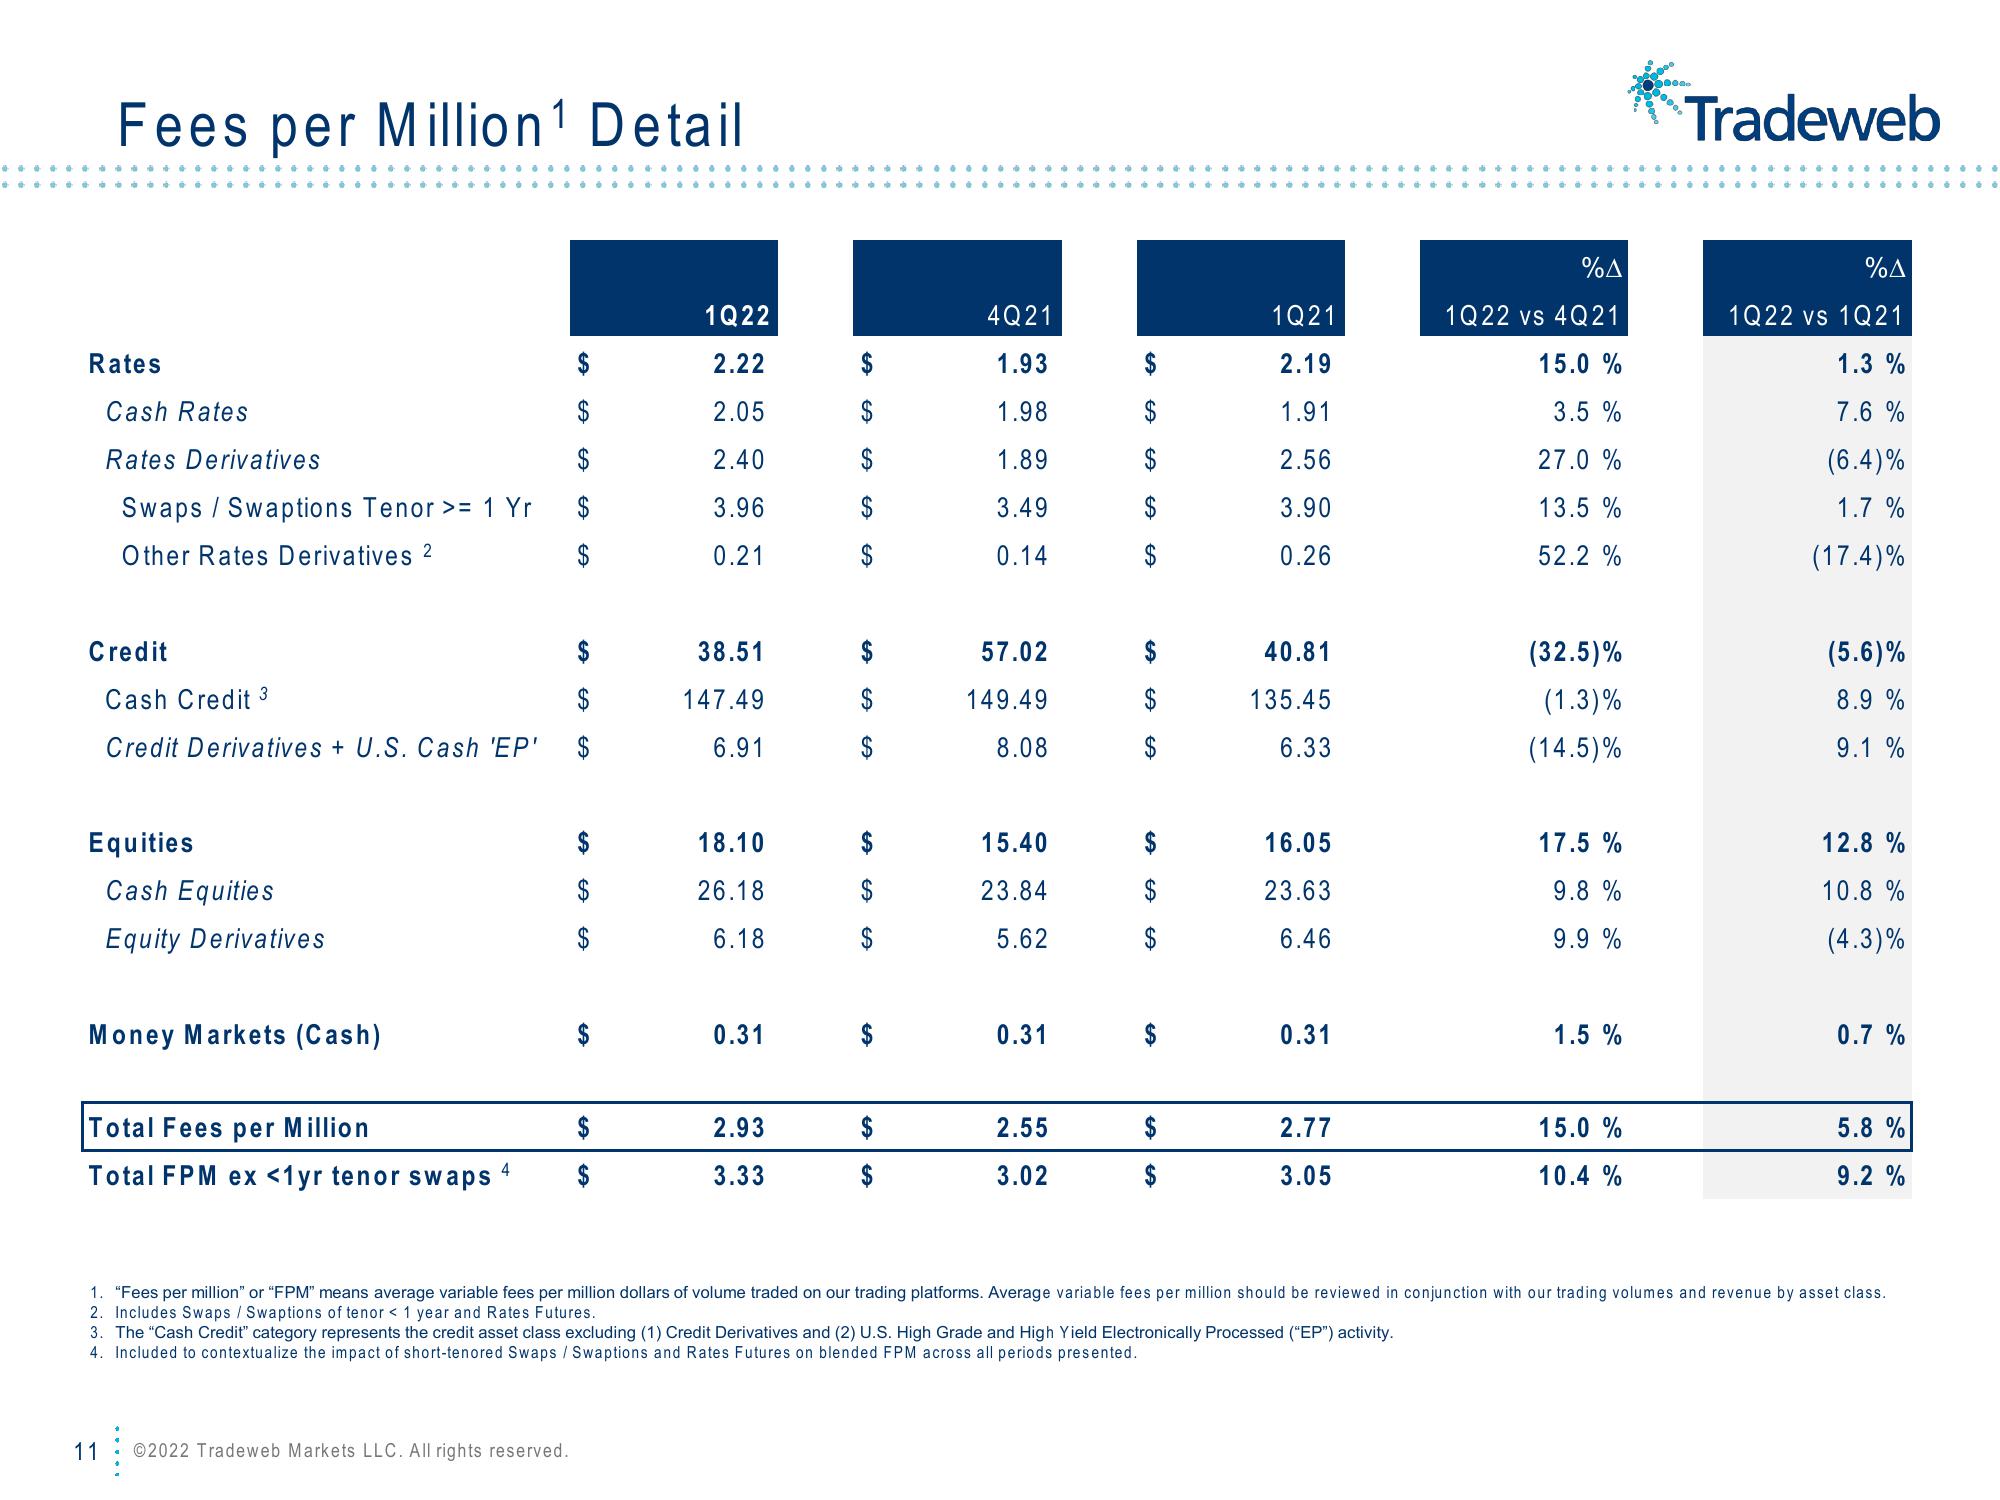
Fees per Million¹ Detail
Rates
Cash Rates
Rates Derivatives
Swaps / Swaptions Tenor >= 1 Yr
Other Rates Derivatives 2
Credit
Equities
Cash Equities
Equity Derivatives
Money Markets (Cash)
Cash Credit 3
$
Credit Derivatives + U.S. Cash 'EP' $
Total Fees per Million
Total FPM ex <1yr tenor swaps
4
SA
$
$
$
11 ©2022 Tradeweb Markets LLC. All rights reserved.
GA
GA
$
$
$
SA
1Q22
2.22
2.05
2.40
3.96
0.21
38.51
147.49
6.91
18.10
26.18
6.18
0.31
2.93
3.33
SA
SA
SA
EA
$
$
SA
SA
4Q21
1.93
1.98
1.89
3.49
0.14
57.02
149.49
8.08
15.40
23.84
5.62
0.31
2.55
3.02
1Q21
2.19
1.91
2.56
3.90
0.26
40.81
135.45
6.33
16.05
23.63
6.46
0.31
2.77
3.05
%Δ
1Q22 vs 4Q 21
15.0 %
3.5 %
27.0%
13.5 %
52.2 %
(32.5)%
(1.3)%
(14.5)%
17.5 %
9.8 %
9.9%
1.5 %
15.0 %
10.4 %
0000
Tradeweb
%A
1Q22 vs 1Q21
1.3 %
7.6%
(6.4)%
1.7 %
(17.4)%
(5.6)%
8.9 %
9.1 %
12.8 %
10.8 %
(4.3)%
0.7 %
5.8 %
9.2 %
1. "Fees per million" or "FPM" means average variable fees per million dollars of volume traded on our trading platforms. Average variable fees per million should be reviewed in conjunction with our trading volumes and revenue by asset class.
2. Includes Swaps / Swaptions of tenor < 1 year and Rates Futures.
3. The "Cash Credit" category represents the credit asset class excluding (1) Credit Derivatives and (2) U.S. High Grade and High Yield Electronically Processed ("EP") activity.
4. Included to contextualize the impact of short-tenored Swaps / Swaptions and Rates Futures on blended FPM across all periods presented.View entire presentation