SoftBank Results Presentation Deck
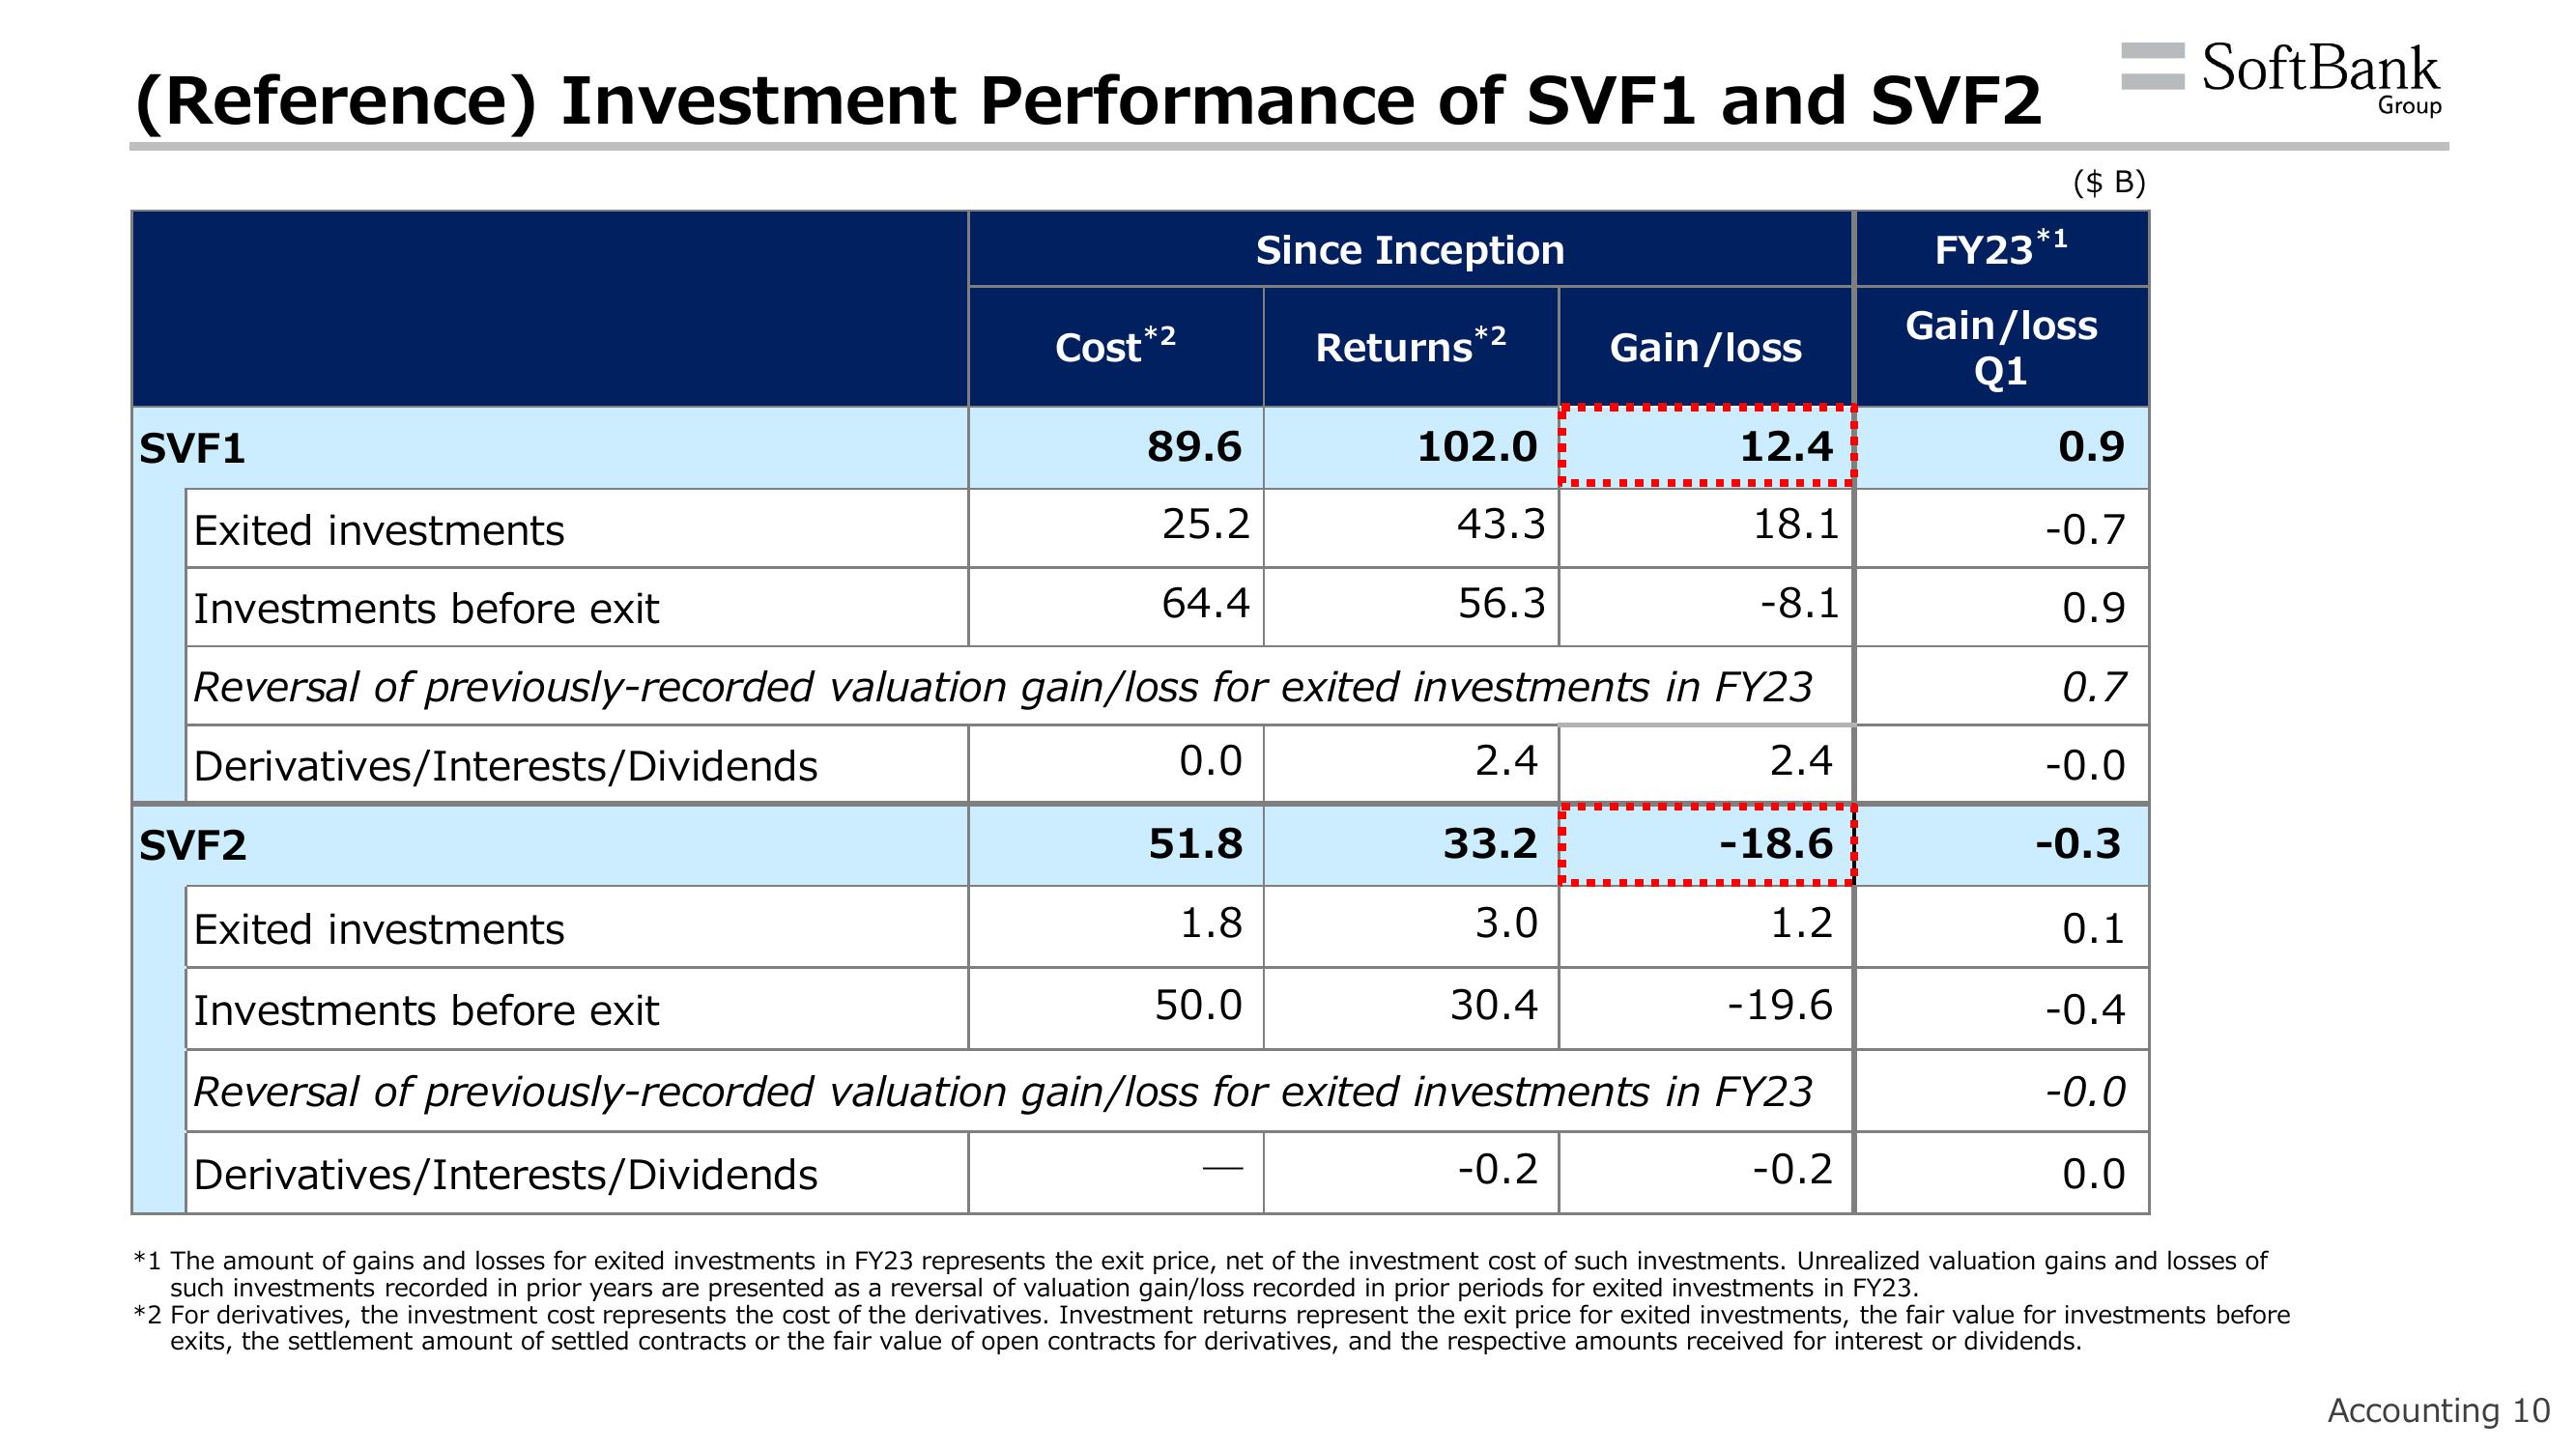
(Reference) Investment Performance of SVF1 and SVF2
FY23*¹
Gain/loss
Q1
SVF1
Exited investments
Derivatives/Interests/Dividends
SVF2
Cost *2
Exited investments
89.6
25.2
64.4
Since Inception
Returns*2
102.0
43.3
56.3
Gain/loss
12.4
Investments before exit
Reversal of previously-recorded valuation gain/loss for exited investments in FY23
0.0
2.4
2.4
51.8
33.2
-18.6
1.8
3.0
1.2
50.0
30.4
- 19.6
---
18.1
-8.1
Investments before exit
Reversal of previously-recorded valuation gain/loss for exited investments in FY23
-0.2
-0.2
($ B)
0.9
-0.7
0.9
0.7
-0.0
-0.3
0.1
-0.4
-0.0
0.0
SoftBank
Derivatives/Interests/Dividends
*1 The amount of gains and losses for exited investments in FY23 represents the exit price, net of the investment cost of such investments. Unrealized valuation gains and losses of
such investments recorded in prior years are presented as a reversal of valuation gain/loss recorded in prior periods for exited investments in FY23.
*2 For derivatives, the investment cost represents the cost of the derivatives. Investment returns represent the exit price for exited investments, the fair value for investments before
exits, the settlement amount of settled contracts or the fair value of open contracts for derivatives, and the respective amounts received for interest or dividends.
Group
Accounting 10View entire presentation