Q2 Quarter 2023
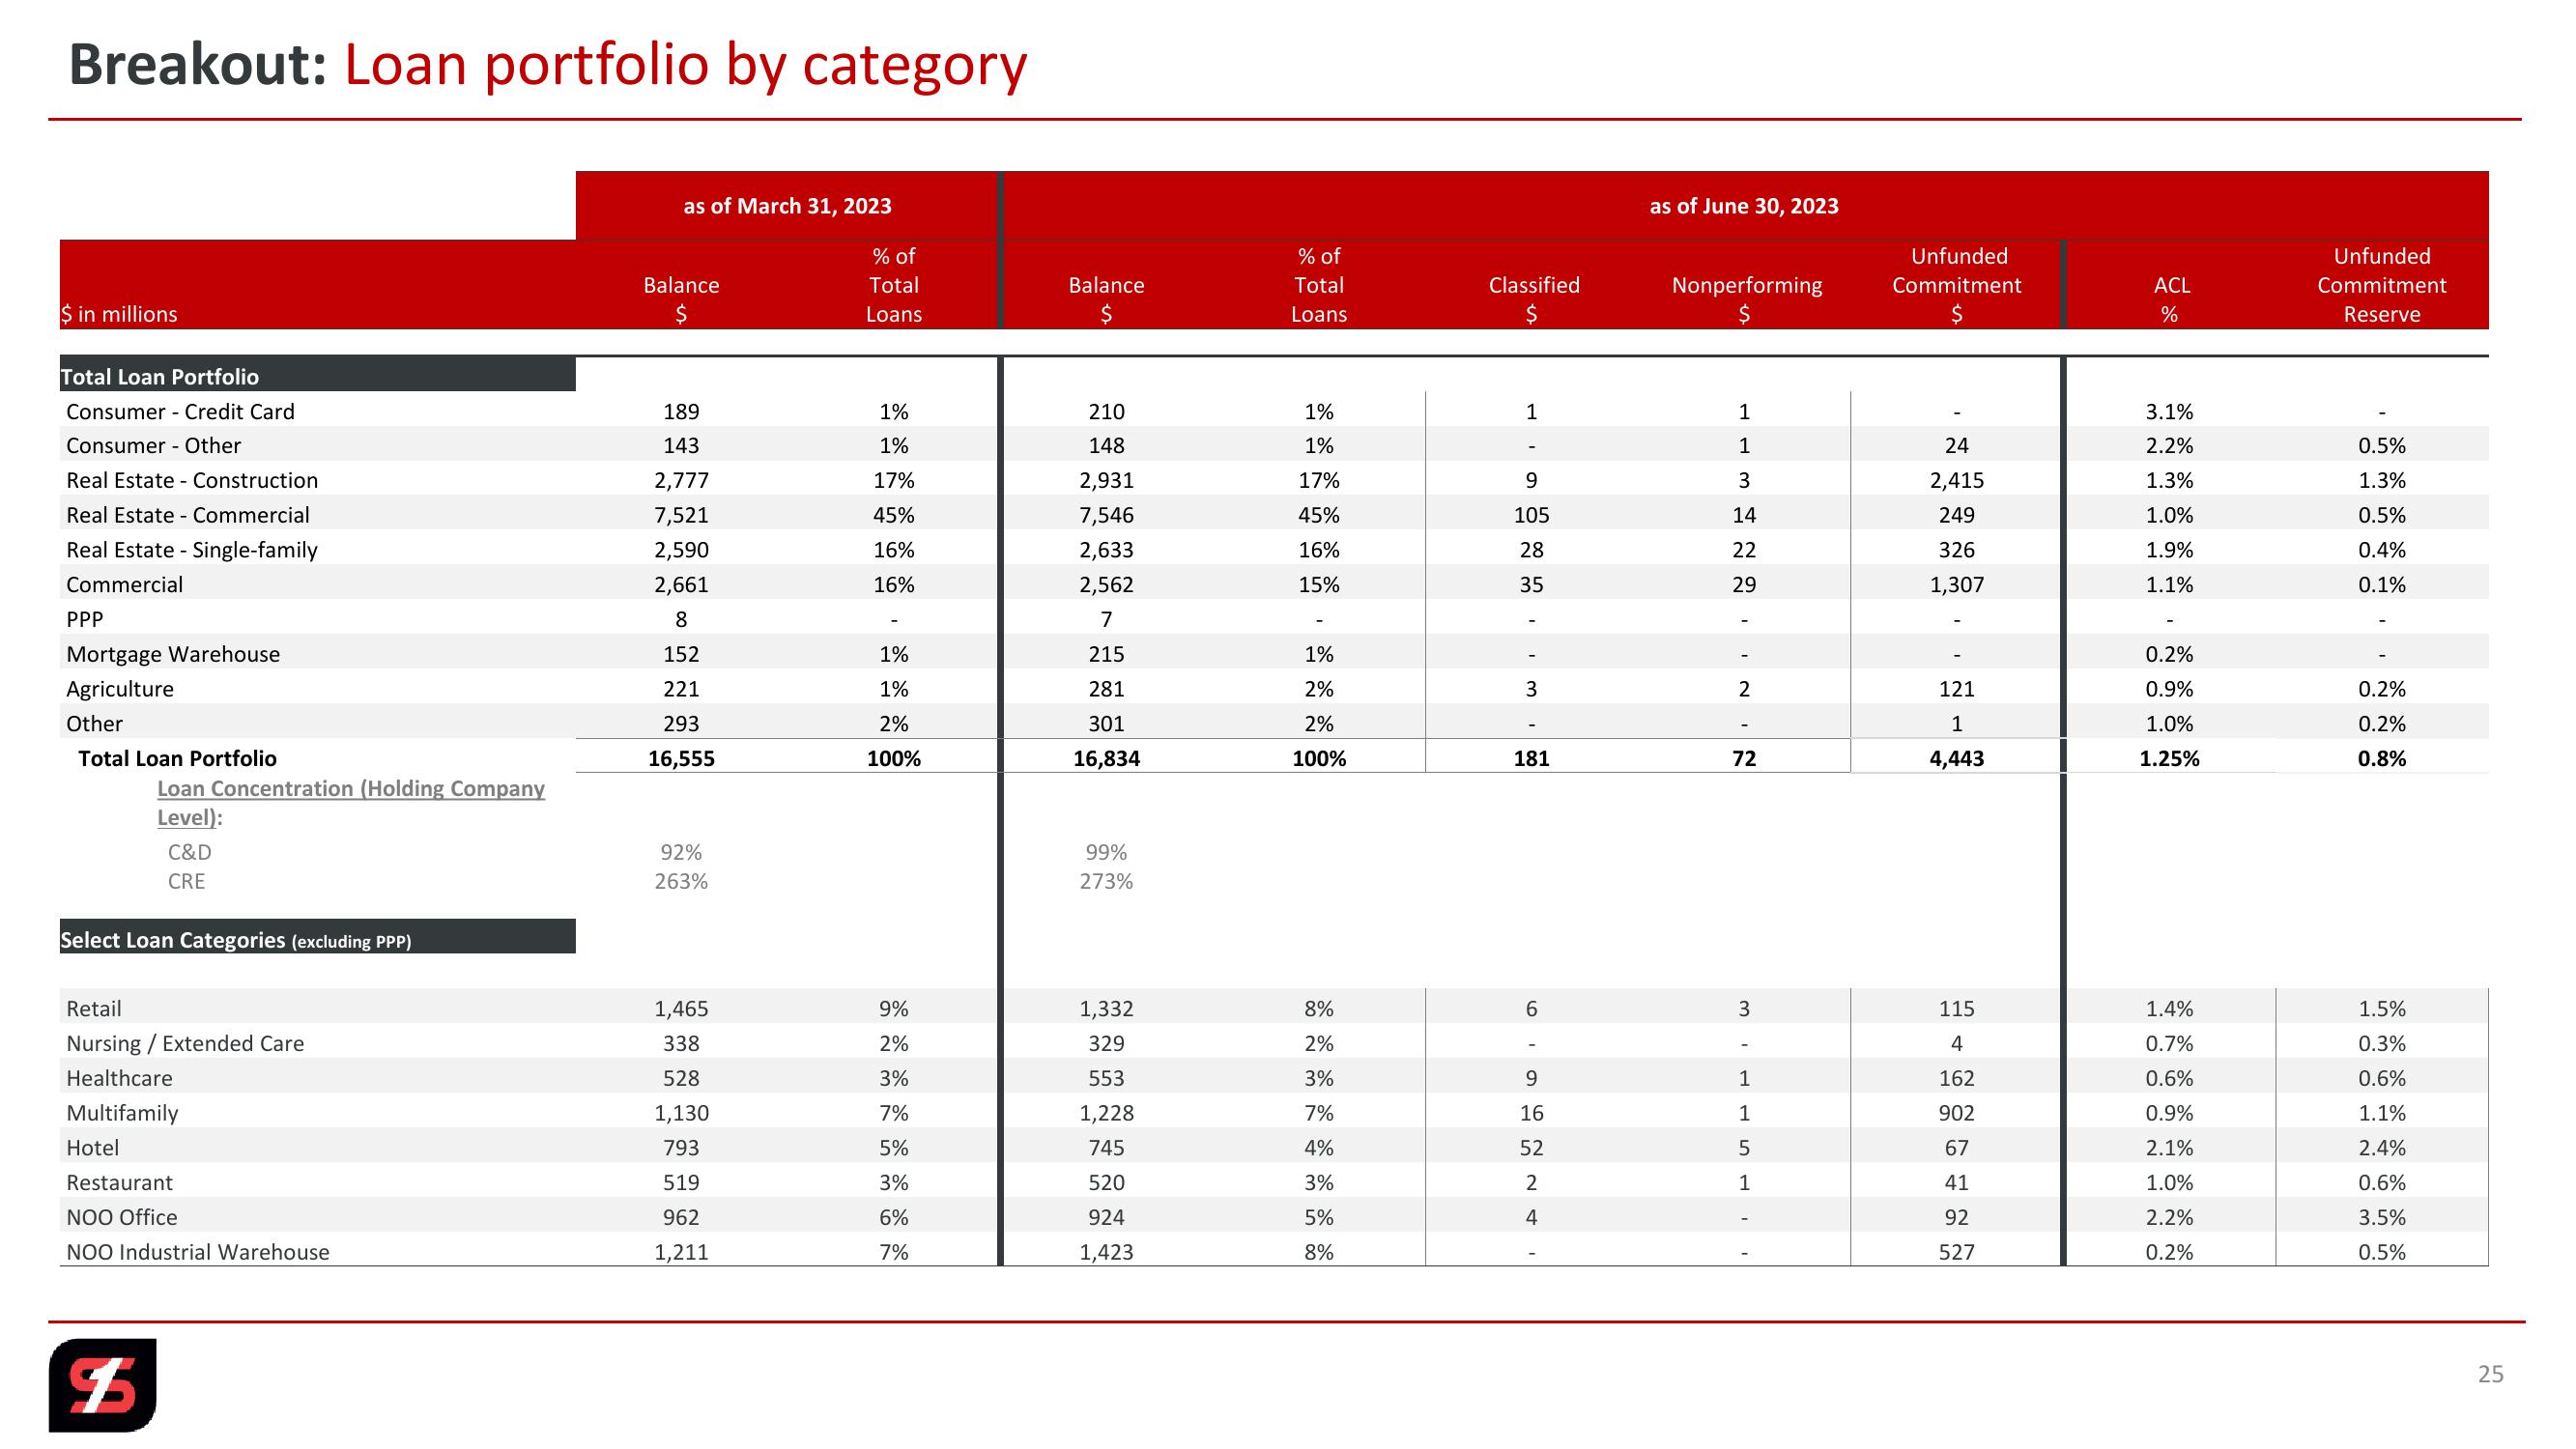
Breakout: Loan portfolio by category
as of March 31, 2023
% of
% of
Balance
Total
Balance
Total
Classified
$
Loans
Loans
as of June 30, 2023
Nonperforming
Unfunded
Commitment
ACL
%
Unfunded
Commitment
Reserve
$ in millions
Total Loan Portfolio
Consumer Credit Card
189
1%
210
1%
1
Consumer Other
143
1%
148
1%
Real Estate
Construction
2,777
17%
2,931
17%
9
Real Estate Commercial
7,521
45%
7,546
45%
105
Real Estate - Single-family
2,590
16%
2,633
16%
28
Commercial
2,661
16%
2,562
15%
35
29
PPP
8
7
Mortgage Warehouse
152
1%
215
1%
Agriculture
221
1%
281
2%
3
Other
293
2%
301
2%
Total Loan Portfolio
16,555
100%
16,834
100%
181
113222,22
3.1%
24
2.2%
0.5%
2,415
1.3%
1.3%
14
249
1.0%
0.5%
326
1.9%
0.4%
1,307
1.1%
0.1%
0.2%
121
0.9%
0.2%
-
1
1.0%
0.2%
72
4,443
1.25%
0.8%
Loan Concentration (Holding Company
Level):
C&D
92%
CRE
263%
99%
273%
Select Loan Categories (excluding PPP)
Retail
1,465
9%
1,332
8%
Nursing/Extended Care
338
2%
329
2%
Healthcare
528
3%
553
3%
Multifamily
1,130
7%
1,228
7%
Hotel
793
5%
745
4%
Restaurant
519
3%
520
3%
NOO Office
962
6%
924
5%
622224
3
115
1.4%
1.5%
-
4
0.7%
0.3%
9
1
162
0.6%
0.6%
16
1
902
0.9%
1.1%
52
5
67
2.1%
2.4%
1
41
1.0%
0.6%
92
2.2%
3.5%
NOO Industrial Warehouse
1,211
7%
1,423
8%
527
0.2%
0.5%
$
25View entire presentation