Sisecam Resources Investor Presentation Deck
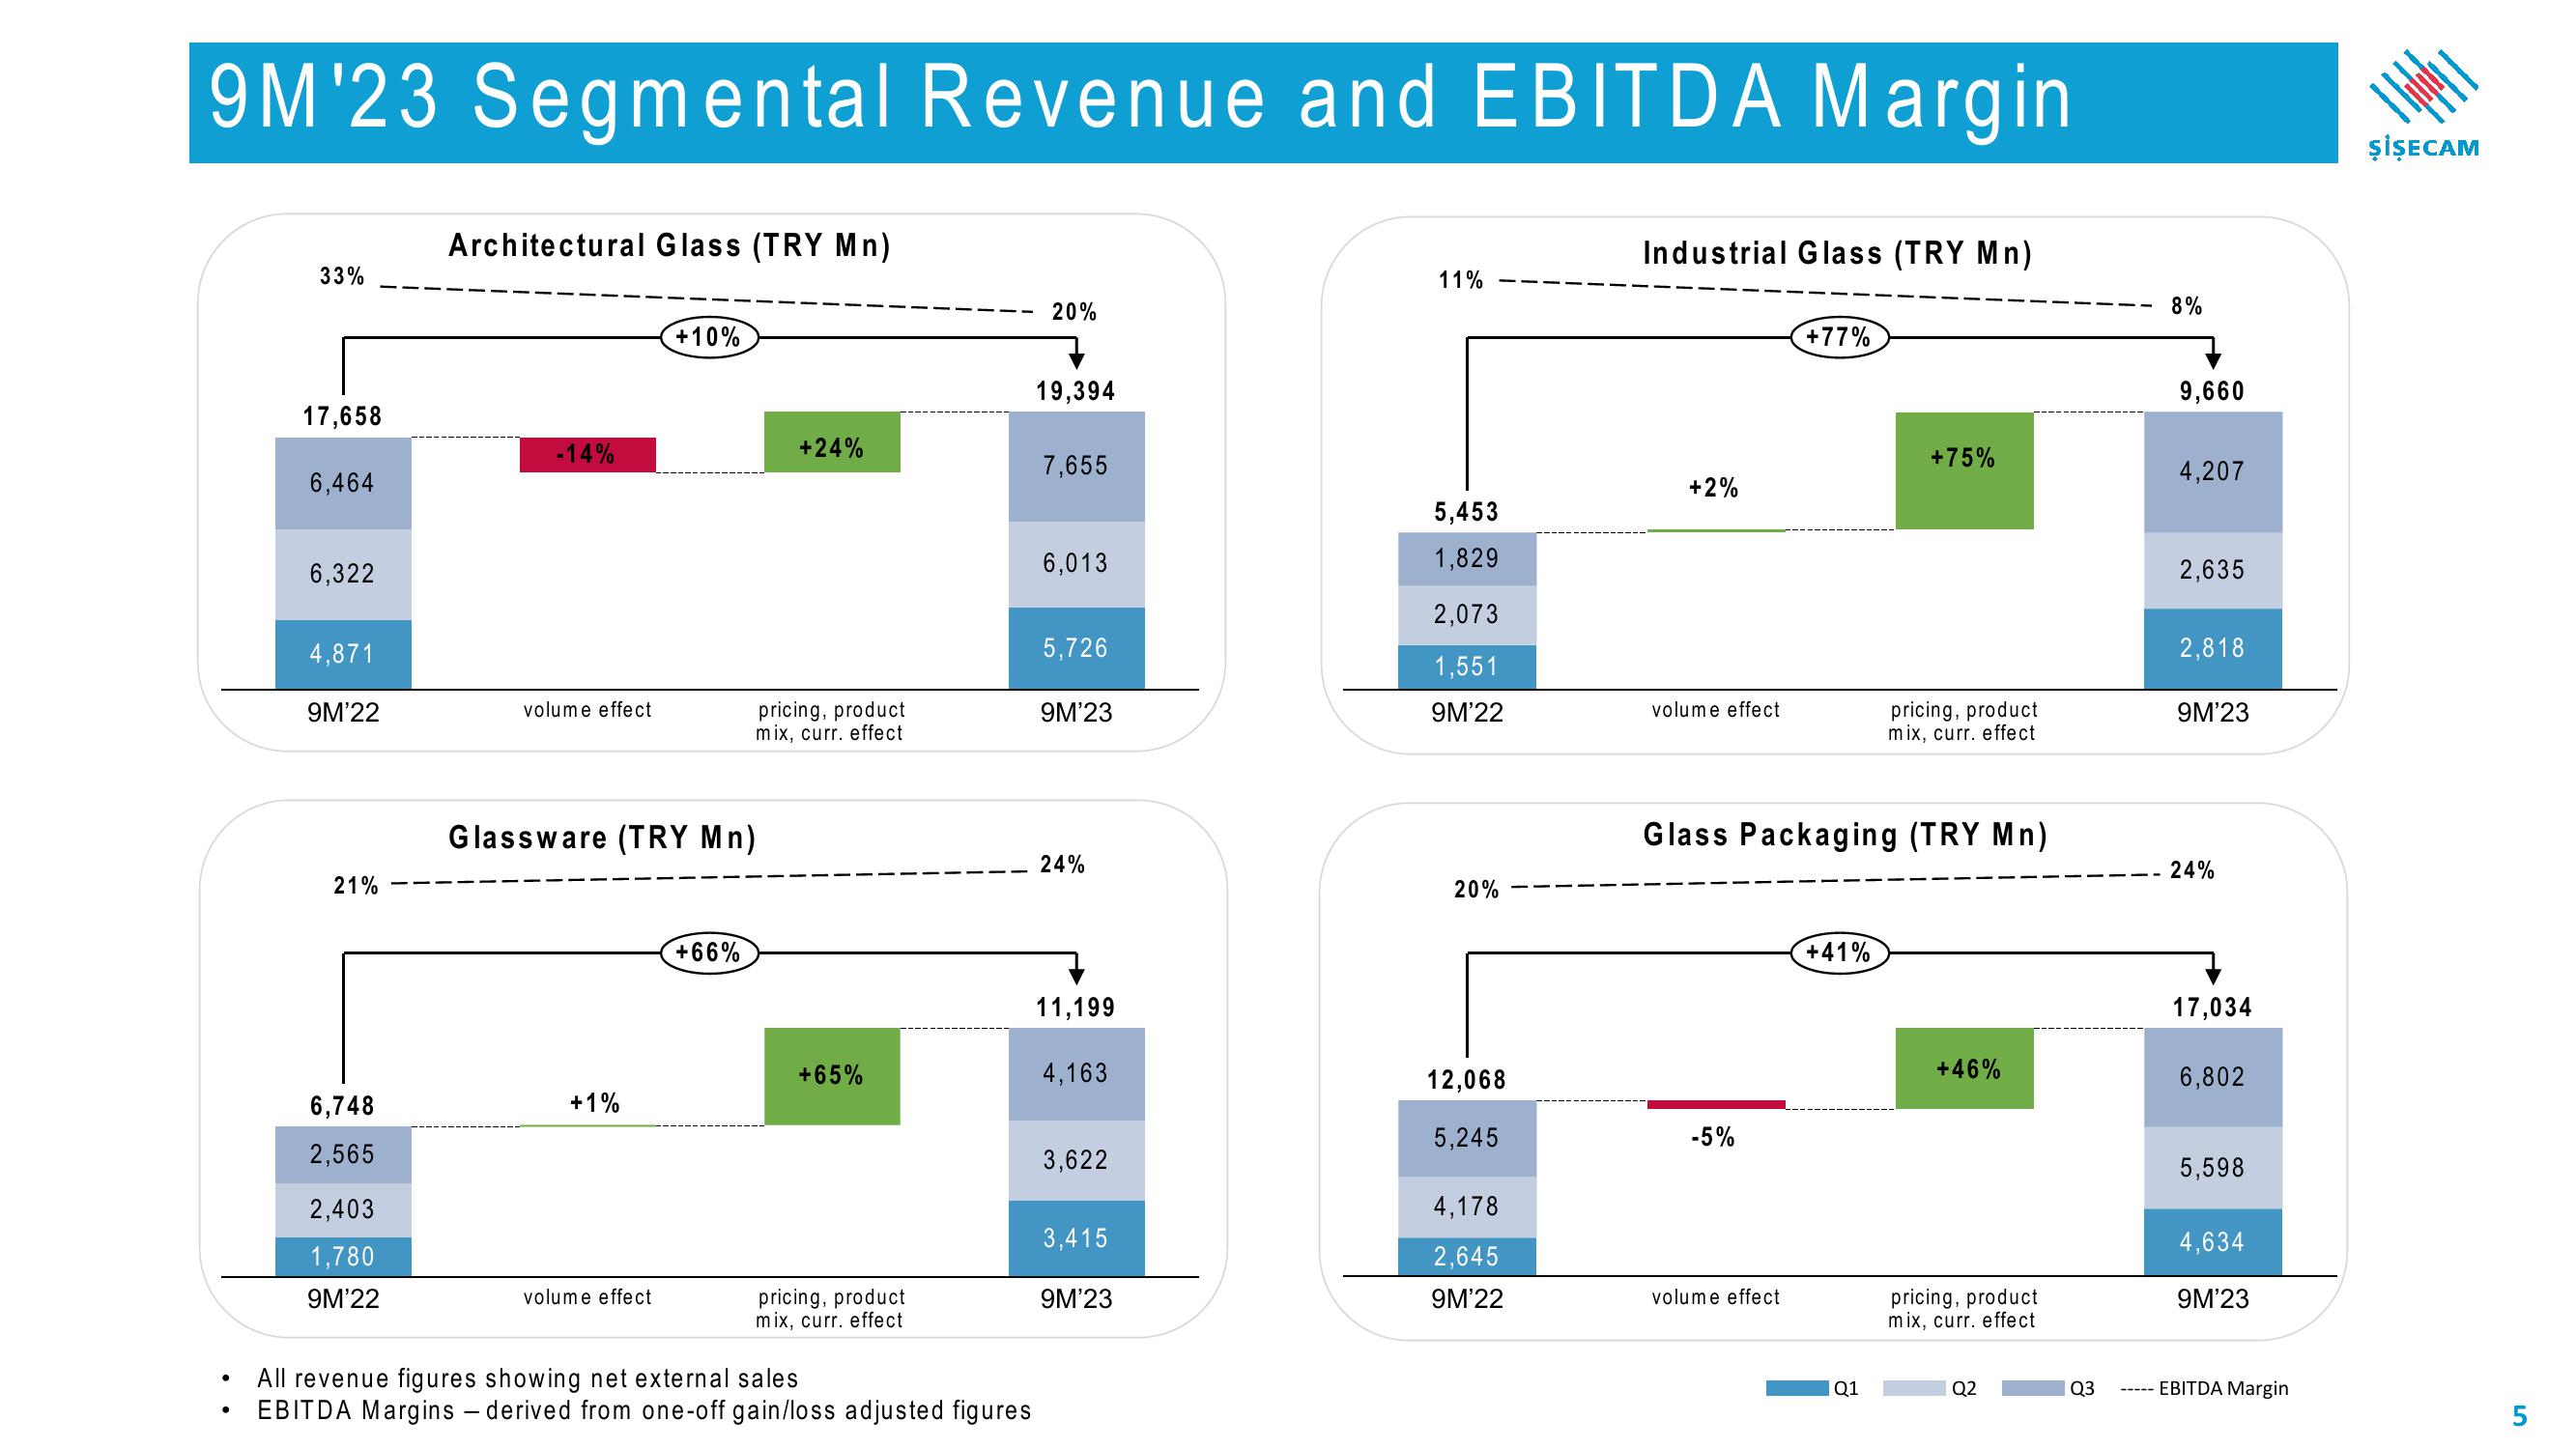
9M¹23 Segmental Revenue and EBITDA Margin
●
●
33%
17,658
6,464
6,322
4,871
9M'22
21%
6,748
2,565
2,403
1,780
9M¹22
Architectural Glass (TRY Mn)
-14%
volume effect
+1%
+10%
Glassware (TRY Mn)
volume effect
+66%
+24%
pricing, product
mix, curr. effect
+65%
pricing, product
mix, curr. effect
All revenue figures showing net external sales
EBITDA Margins- derived from one-off gain/loss adjusted figures
20%
19,394
7,655
6,013
5,726
9M'23
24%
11,199
4,163
3,622
3,415
9M'23
11%
5,453
1,829
2,073
1,551
9M'22
20%
12,068
5,245
4,178
2,645
9M'22
Industrial Glass (TRY Mn)
+2%
volume effect
-5%
+77%
volume effect
Glass Packaging (TRY Mn)
+41%
+75%
Q1
pricing, product
mix, curr. effect
+46%
pricing, product
mix, curr. effect
Q2
Q3
11111
8%
9,660
4,207
2,635
2,818
9M'23
24%
17,034
6,802
5,598
4,634
9M'23
EBITDA Margin
I
ŞİŞECAM
5View entire presentation