Bed Bath & Beyond Results Presentation Deck
FINANCIAL OUTLOOK
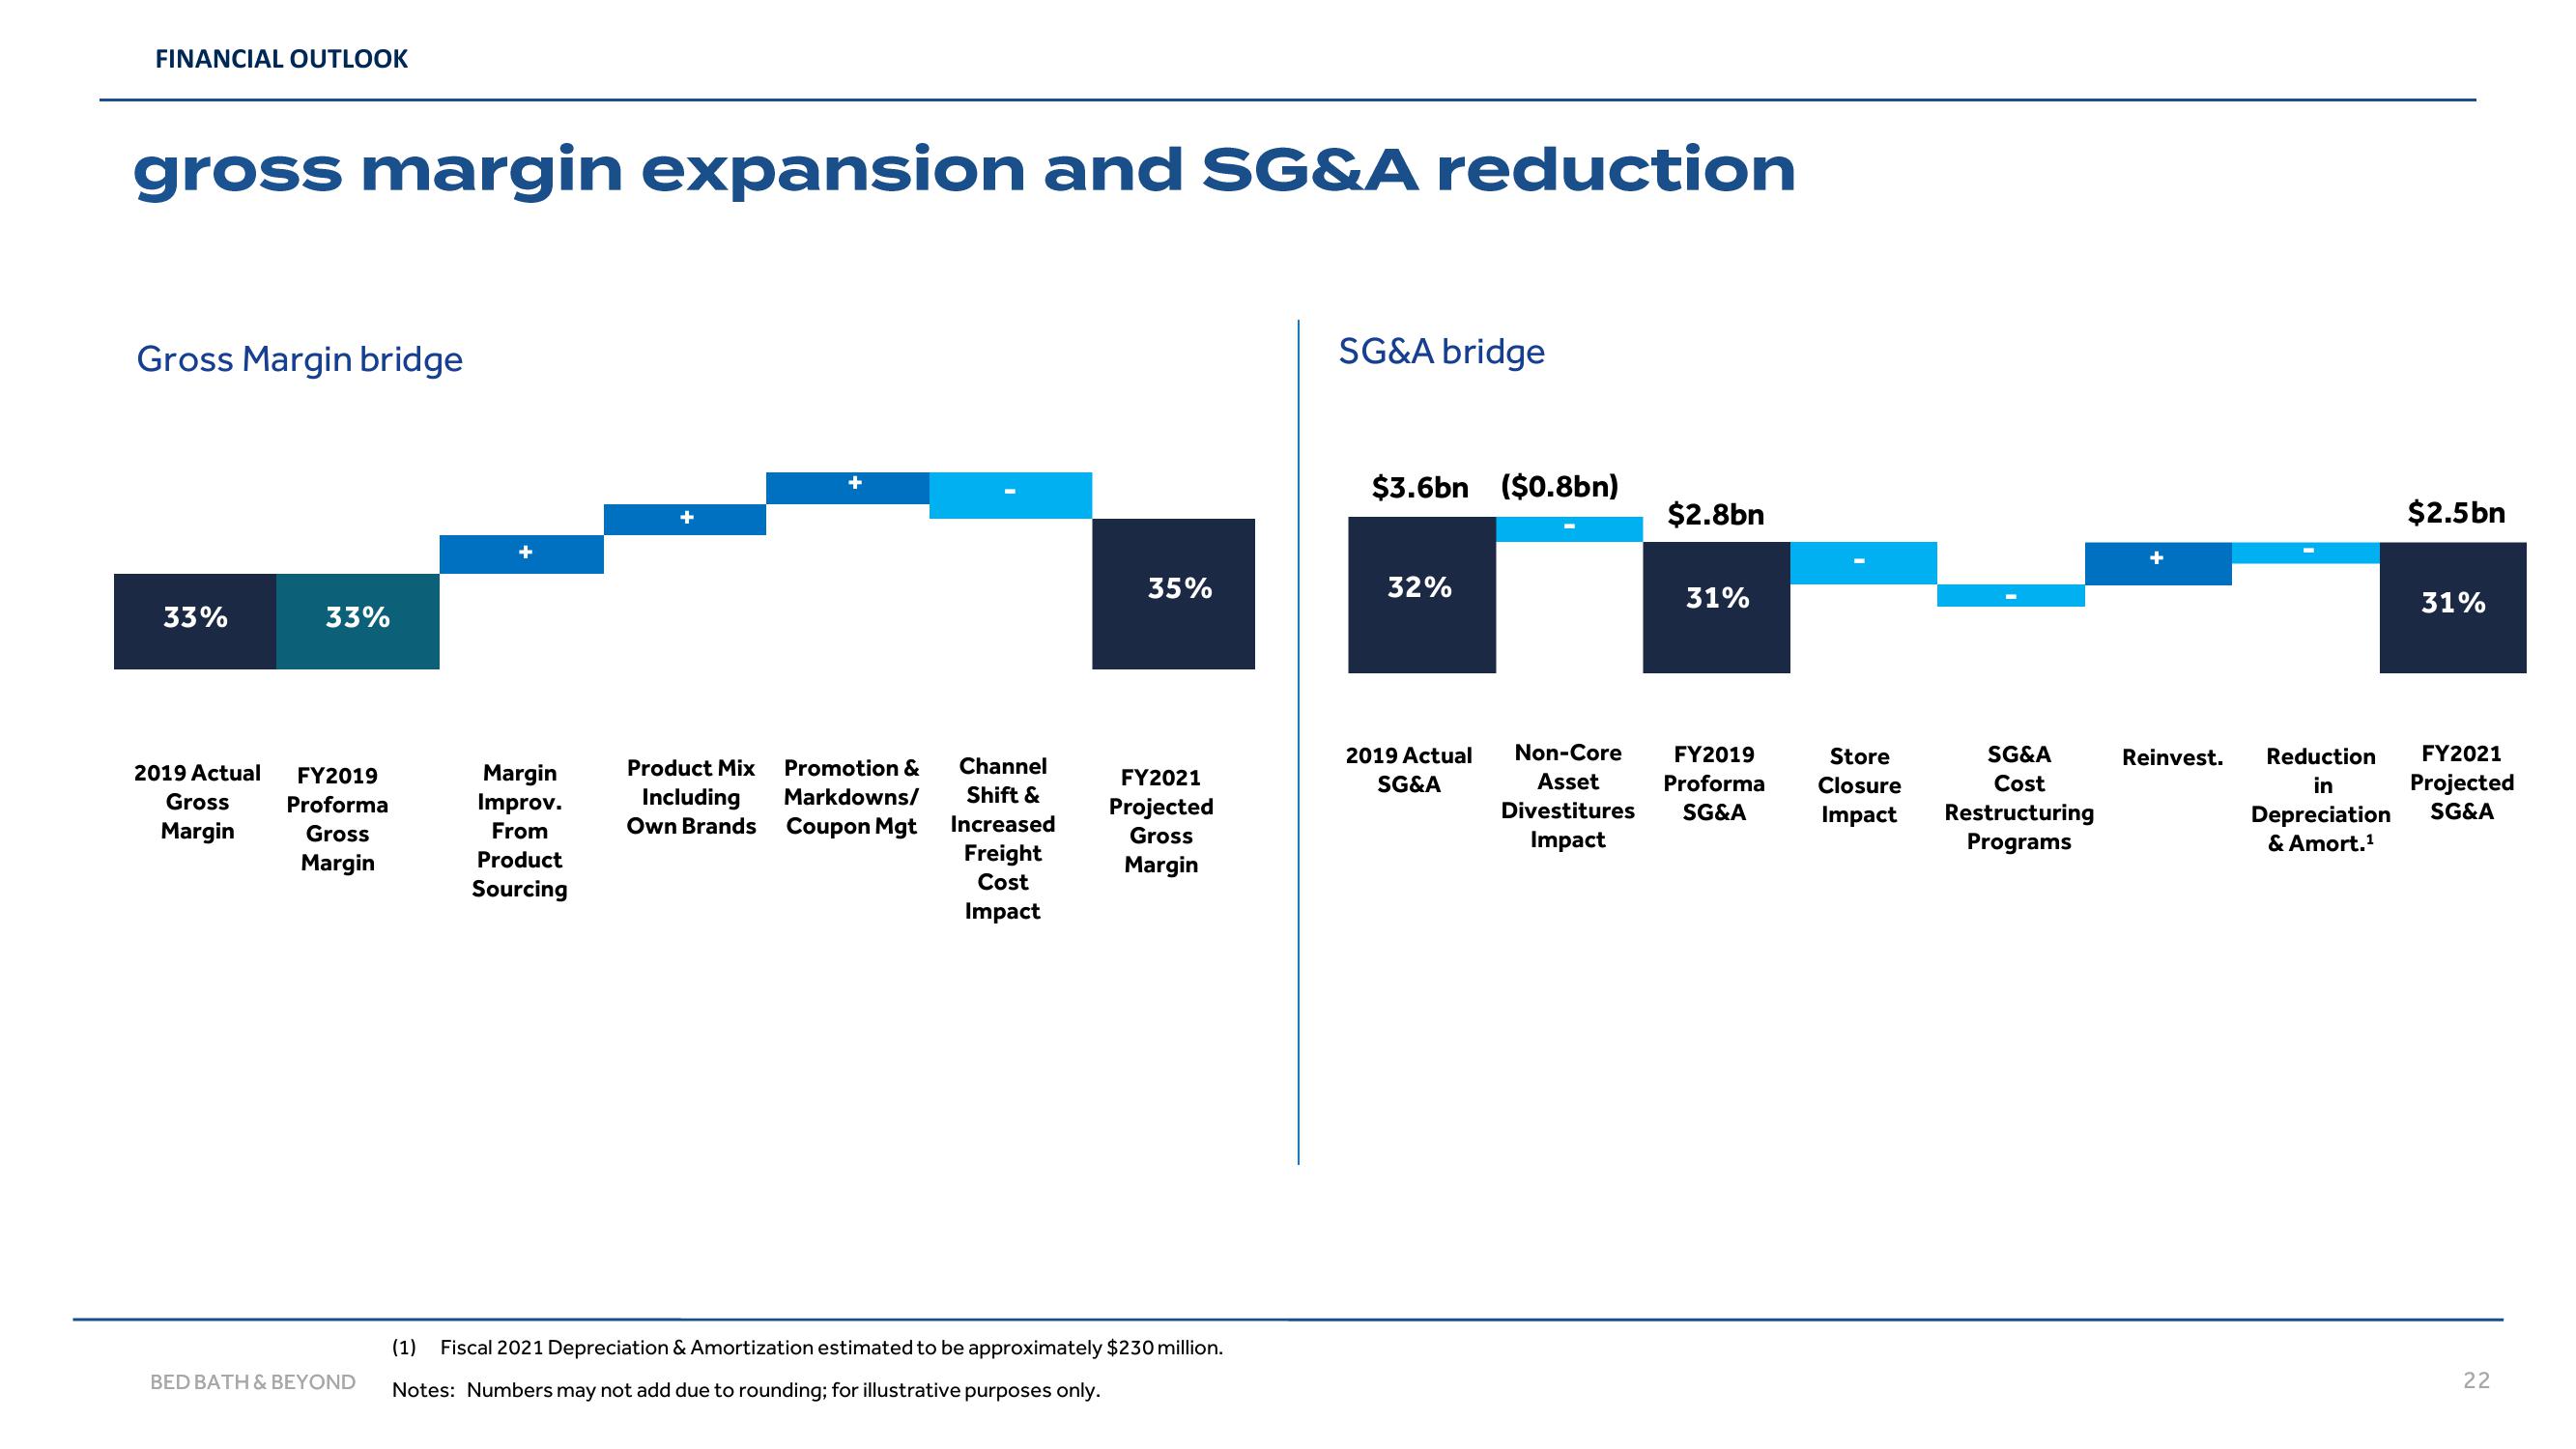
gross margin expansion and SG&A reduction
Gross Margin bridge
33%
2019 Actual
Gross
Margin
33%
FY2019
Proforma
Gross
Margin
BED BATH & BEYOND
+
Margin
Improv.
From
Product
Sourcing
+
Product Mix
Including
Own Brands
+
Promotion &
Markdowns/
Coupon Mgt
Channel
Shift &
Increased
Freight
Cost
Impact
35%
FY2021
Projected
Gross
Margin
(1) Fiscal 2021 Depreciation & Amortization estimated to be approximately $230 million.
Notes: Numbers may not add due to rounding; for illustrative purposes only.
SG&A bridge
$3.6bn ($0.8bn)
32%
2019 Actual
SG&A
$2.8bn
31%
Non-Core FY2019
Asset Proforma
Divestitures SG&A
Impact
Store
Closure
Impact
SG&A
Cost
Restructuring
Program
+
Reinvest. Reduction
in
Depreciation
& Amort.¹
$2.5bn
31%
FY2021
Projected
SG&A
22View entire presentation