UBS Results Presentation Deck
Asset Management
Profit before tax
m
Operating
income
m
Cost / income ratio
Invested assets
end of period, bn
Performance fees
Net management
fees
739
169
1,162
401
Gain from the sale of Fondcenter¹
36%²
980
774
255
571
88
505
(2)
Gain from the sale of Fondcenter¹
518
(71%)
+27% excluding
Fondcenter gain
48%
227
1,092
(49%)
+0% excluding
Fondcenter gain
637
92
545
64%
+18%
1,121
255
218
666
*40**
588
62%
Credit loss (expenses) /releases
1,174
214
3Q20
4Q20
1Q21
2Q21
UBS 1 Subsequently renamed Clearstream Fund Centre; 2 71% excluding the gain from the sale of Fondcenter
593
-33-
560
64%
1,154
3Q21
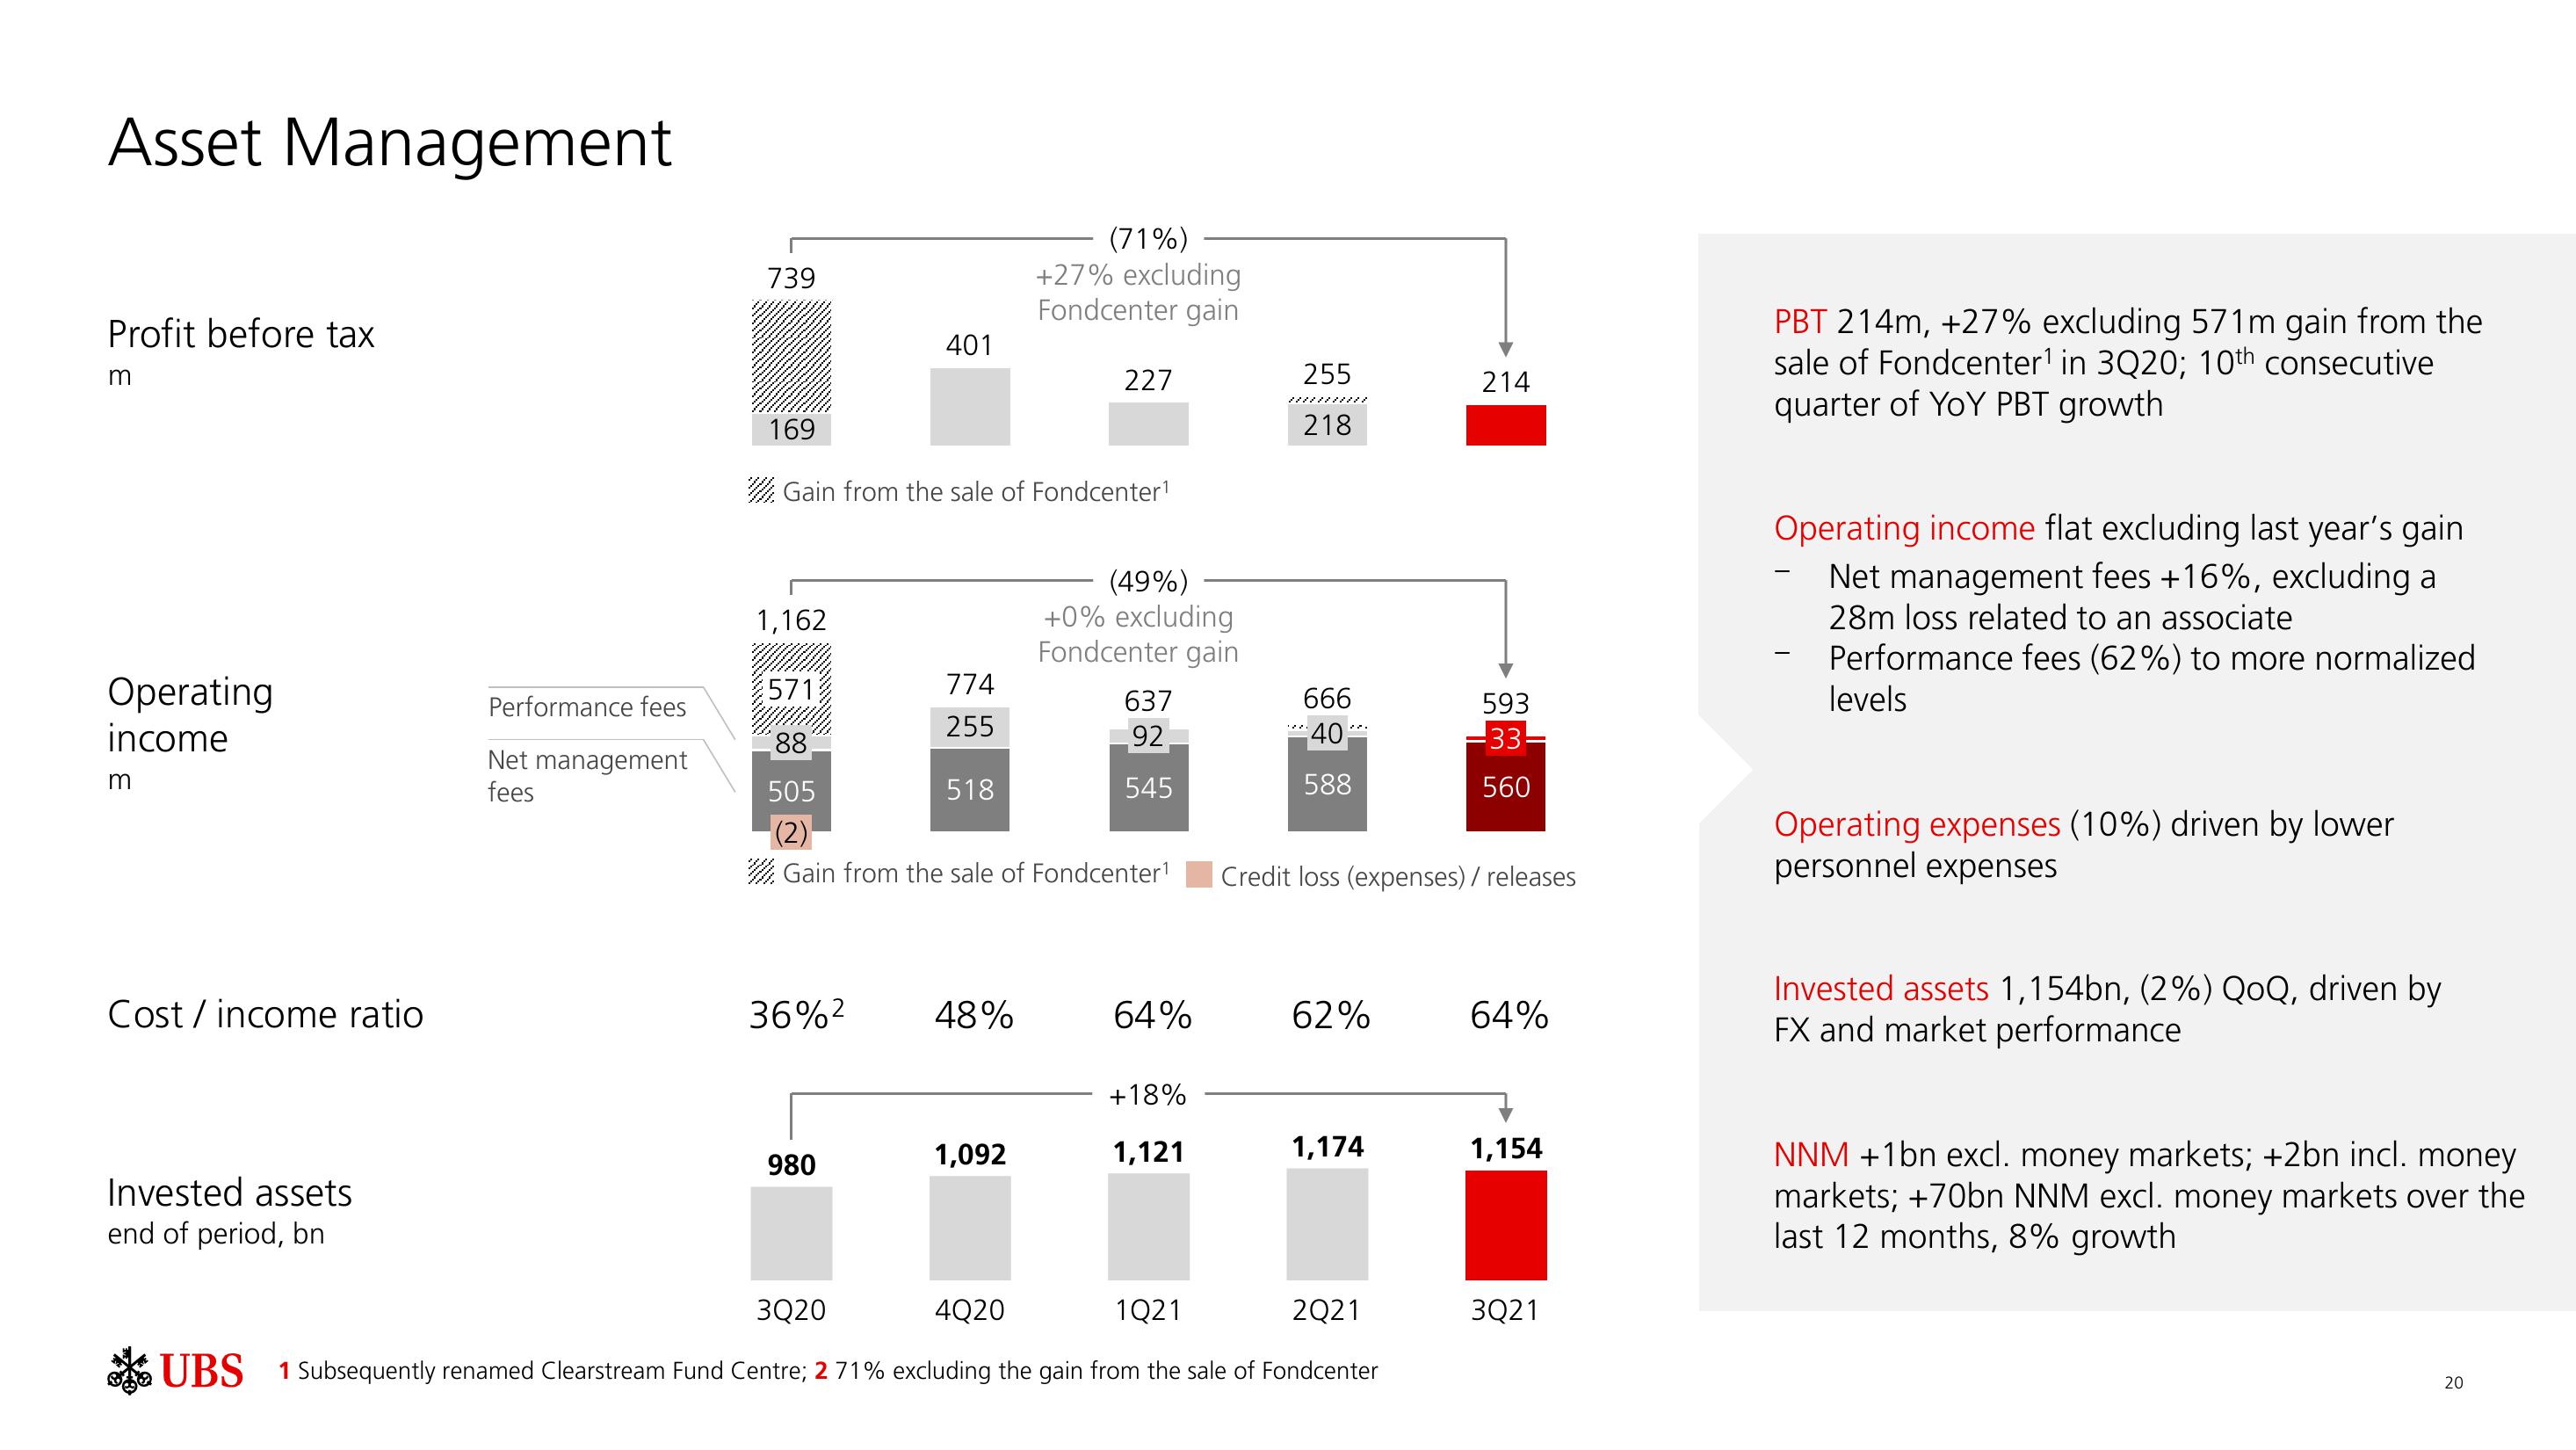
PBT 214m, +27% excluding 571m gain from the
sale of Fondcenter¹ in 3Q20; 10th consecutive
quarter of YoY PBT growth
Operating income flat excluding last year's gain
Net management fees +16%, excluding a
28m loss related to an associate
Performance fees (62%) to more normalized
levels
-
-
Operating expenses (10%) driven by lower
personnel expenses
Invested assets 1,154bn, (2%) QoQ, driven by
FX and market performance
NNM +1bn excl. money markets; +2bn incl. money
markets; +70bn NNM excl. money markets over the
last 12 months, 8% growth
20View entire presentation